Scoring climate risks: which countries are the most resilient?
Ashim Paun
Executive summary
Trends in reserve management: 2020 survey results
Interview: Ma. Ramona Santiago
Scoring climate risks: which countries are the most resilient?
A hundred ways to skin a cat – or some practical thoughts on benchmark replication
Developing a sovereign ALM framework: a case study of Mauritius
Developing an integrated information system for reserve management: the experience of Peru
Appendix 1: Survey questionnaire
Appendix 2: Survey responses and comments
Appendix 3: Reserve statistics
Climate change poses risks to all countries. A global drive to reduce carbon emissions has brought challenges to energy systems and economies, and adaptive responses are necessary as populations suffer the negative impacts. Strong institutions, information and money are all part of such a response. Meanwhile, for economies capable of producing cleaner technologies, opportunities abound. In this chapter, we examine 67 countries that have been ranked from the most resilient to the most vulnerable.
Central banks have been paying increasing attention to climate change and broader environmental, social and governance (ESG) considerations. This has focused on regulation, financial stability and encouraging green investment, as well as how to adapt their own balance sheets accordingly. To that end, the Network for Greening the Financial System (NGFS) was set up by eight central banks and supervisors in December 2017. By the end of 2019, membership had increased to 54 members and 12 observers, reflecting the increasing importance attached to climate change by the central banking community.
Clearly, central banks face different challenges to other investors in promoting socially responsible investing (SRI) for their own portfolios. Liquidity and safety have to take priority in foreign exchange reserves, and reserve managers need to work within the parameters of their mandate to avoid conflicts with monetary policy and market neutrality. However, whether reserve managers are managing foreign exchange reserves, own funds or their pension assets, climate change risks are inherent. We are entering a crucial decade for climate change. Worsening impacts have focused attention – extreme weather events have proven to be more severe and, in many geographies, more widespread due to warming, including wildfires and floods (as we have recently seen in Australia and Indonesia). However, policy-making has looked increasingly detached from scientific evidence in many countries.
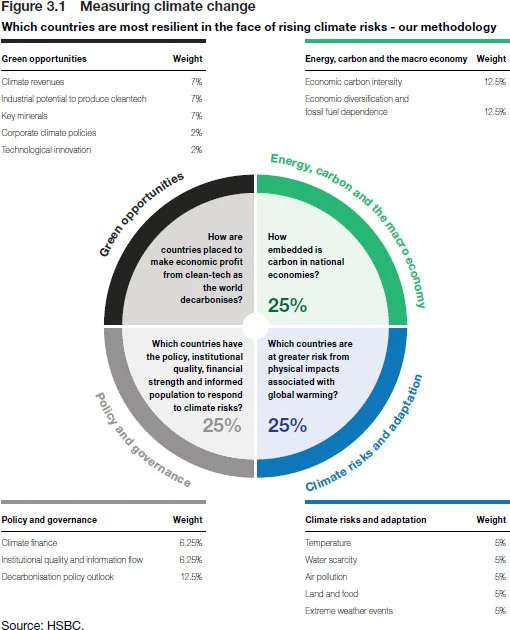
Nevertheless, despite political headwinds in certain countries and disappointingly slow progress at the most recent United Nations Climate Change Conference in Madrid (COP25), the world as a whole is increasingly focused on climate change. Encouragingly, the improving economics of clean alternatives to fossil fuels mean rapid deployment in many countries. All countries need to address climate risks, but some look better positioned than others – more resilient and less vulnerable. Therefore, in this chapter we seek to score and rank countries across a range of risk factors, as per the infographic in Figure 3.1.

| 1. Finland | 35. Poland |
| 2. Germany | 36. Brazil |
| 3. Sweden | 37. Argentina |
| 4. US | 38. Russia |
| 5. Denmark | 39. India |
| 6. Canada | 40. Turkey |
| 7. UK | 41. Croatia |
| 8. Switzerland | 42. South Africa |
| 9. France | 43. Thailand |
| 10. Norway | 44. Philippines |
| 11. Austria | 45. UAE |
| 12. Netherlands | 46. Indonesia |
| 13. Portugal | 47. Mauritius |
| 14. Australia | 48. Peru |
| 15. New Zealand | 49. Qatar |
| 16. Spain | 50. Jordan |
| 17. Czech Republic | 51. Kazakhstan |
| 18. China | 52. Colombia |
| 19. Korea | 53. Morocco |
| 20. Japan | 54. Vietnam |
| 21. Belgium | 55. Pakistan |
| 22. Italy | 56. Sri Lanka |
| 23. Ireland | 57. Lebanon |
| 24. Singapore | 58. Serbia |
| 25. Chile | 59. Tunisia |
| 26. Estonia | 60. Kenya |
| 27. Greece | 61. Bahrain |
| 28. Slovenia | 62. Egypt |
| 29. Hungary | 63. Kuwait |
| 30. Malaysia | 64. Saudi Arabia |
| 31. Israel | 65. Oman |
| 32. Mexico | 66. Bangladesh |
| 33. Romania | 67. Nigeria |
| 34. Lithuania | |
| Source: HSBC based on our proprietary analysis of 35 indicators, explored via 54 datapoints for each country Colour coding: Grey = developed market, Black = emerging market, Red = frontier market |
|
The challenge has been distilled here into a single question: “Which countries are most resilient in the face of rising climate risks?” To help answer this, we have examined 67 developed (DM), emerging (EM) and frontier market (FM) countries. We have brought together many of the lessons from previous iterations, but also added several new indicators. Hence, the chapter is organised into four sections, each seeking to answer a single question, which together feed into the main question above. The four section-related questions are as follows:

-
-
How embedded is carbon in national economies?
-
-
-
Which countries are at greater risk from physical impacts associated with global warming?
-
-
-
Which countries have the policy, institutional quality, financial strength and informed population to respond to climate risks?
-
-
-
How are countries placed to make economic profit from cleantech (clean technology) as the world decarbonises?
-
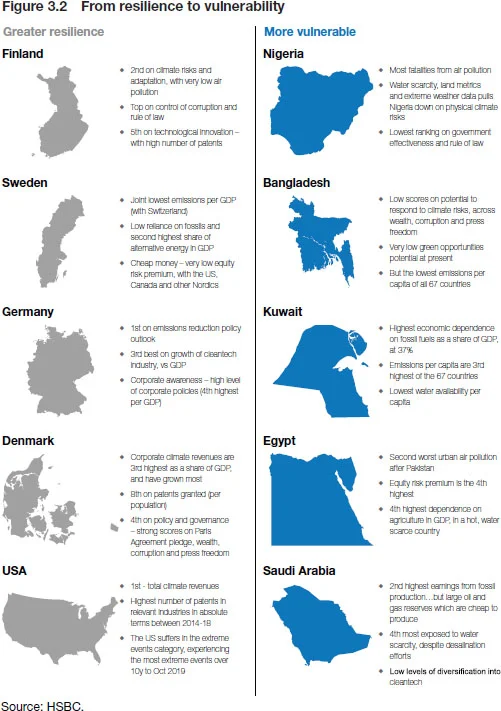
We focus on answering these questions and building an overall picture of resilience versus vulnerability, using 35 indicators explored via 54 data points for each country. The five best-placed countries, as identified in Table 3.1, are led by Northern European nations, with Finland being first, Germany in second and Sweden in third. The most vulnerable countries, dominated by energy economies and those in warmer latitudes, are in descending order: Nigeria, Bangladesh and Oman.
The full rankings are shown in Table 3.1 (above), although note these are sensitive to the weighting of segments of the overall analysis. Thus, while the final rankings are interesting, digging into the detail is more illuminating – ie, more value can be found in specific areas of risk and individual indicators. The analysis provides reserve managers with a tool to assess where they have asset exposure among their holdings, whether in government, sovereign and semi-sovereign bonds, corporate debt or equities, and then to examine the specific areas of analysis to understand whether countries to which they are exposed pose a greater or lesser risk. Figure 3.2, opposite, presents some of the details of the reasons for the resilience and vulnerability of the top five and bottom five ranked countries.
Box 3.1 How does climate change impact shortterm and long-term growth?11 By Janet Henry, HSBC global chief economist.
The global economic outlook for 2020–21 is completely dominated by the severe damage being inflicted by the impact of COVID-19 – an extremely dangerous pandemic in a highly integrated world, the likes of which we have never seen before. Our forecasts point to a deeper economic contraction in 2020 than during the global financial crisis. However, much depends on what comes next: how long the suppression measures last, what medical science can deliver and the effectiveness of further policy support.
Against this backdrop, the direct impact of climate change on economic growth is impossible to gauge. However, that was also the case before the outbreak of the virus. Growth forecasts by national governments and multilateral organisations – which are typically for two, or at most five, years ahead – have never claimed to account for environmental impact on their growth projections. They only measure the direct impact of an extreme weather event on current GDP when, for instance, a drought or hurricane occurs, whether it be from the likes of infrastructure damage, commodity price shocks or more general disruption to commerce.
Last year, HSBC’s Australian economist, Paul Bloxham, estimated that even before their extensive bushfires, an extended drought had already resulted in Australian farm GDP falling by around 10% over the year to Q3 2019, subtracting around 0.2 points from overall GDP growth. The bushfires then compounded the effect of already dry conditions on rural output, particularly given the destruction of livestock, as well as the broader impact on tourism and retail spending.
Over the medium to longer term, if much more severe extreme weather events do occur, the financial costs – such as from asset price declines as a consequence of uninsured losses – could have a much wider influence on economies. In addition, the impact may not be confined to a single country or region. For example, disruption to agricultural output in one part of the world can push up global food prices, and squeeze real income growth in another. Moreover, extreme weather events not only affect the volatility, level and/or growth rate of GDP, they can also lead to misjudgements of “potential” GDP. Some of this can be through a negative impact on productivity.
With their geographical location and the larger share of GDP accounted for by agriculture, developing countries tend to face greater growth risks from higher temperatures. However, recent studies have shown that the negative impact on growth from global warming in advanced economies could also be widespread. By examining changes in temperature by season and across US states, researchers at the Richmond Fed22 Riccardo Colacito, Bridget Hoffman, Toan Phan and Tim Sablik, “The Impact of Higher Temperatures on Economic Growth,” Federal Reserve Bank of Richmond, EB18–08 (August 2018). estimated that higher summer temperatures in 1998–2012 had lowered GDP growth not just in agriculture, forestry and fishing but in a whole range of larger sectors – from construction and real estate to a range of services – which had more than offset some positive effects on utilities and mining. Admittedly, the effects were very small in the short term, but they also found evidence that rising temperatures could lower overall US growth significantly. Assuming no action to mitigate the effects of higher temperatures, they estimated that the US annual growth rate could be lowered by 0.2–0.4% on a low emissions scenario, and up to 1.2% per year on a high emissions scenario by 2070–99.
While these estimates of the likely impact may seem far in the future, as the urgency to address climate change intensifies academics and policy-makers are aware that policy decisions will have to embrace the environmental impact on growth much sooner. This also includes the extent to which current growth is occurring at the expense of future growth. For instance, economist Diane Coyle33 Diane Coyle, GDP: A Brief but Affectionate History (Princeton: Princeton University Press, 2014). has argued that the depletion of natural resources needs to be accounted for in measures of national income in the same way as the depreciation of machinery, equipment and infrastructure.
By Janet Henry
Energy, carbon and the macro economy
The carbon intensity of countries varies hugely, with Switzerland and France being the best placed countries. This section will examine the reasons for such variety, and also analyse fossil fuel dependence to gain a better understanding of transition risk. It should be noted that the analysis ranks Middle East and North Africa (MENA) countries as the most vulnerable.

Carbon intensity
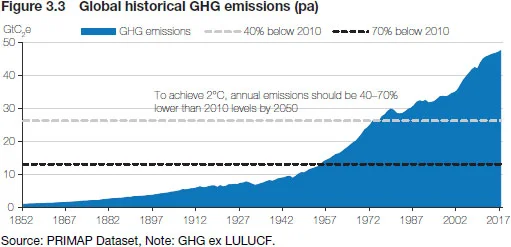
To achieve the Paris Agreement goals of restricting the increase in global average temperature to below 2°C above pre-industrial levels (by 2100) and limiting the temperature increase to 1.5°C above pre-industrial levels, virtually all countries around the world will need to remove carbon and other greenhouse gases (GHGs) from their energy systems and broader economies.44 At COP25 progress was limited – see HSBC Global Research, “COP25: Intransigence” (16 December 2019). Meanwhile, GHGs are still rising, with the International Energy Agency (IEA) reporting that 2018 CO2 emissions were the highest yet (see Figure 3.3, above).
How embedded is carbon in national economies?
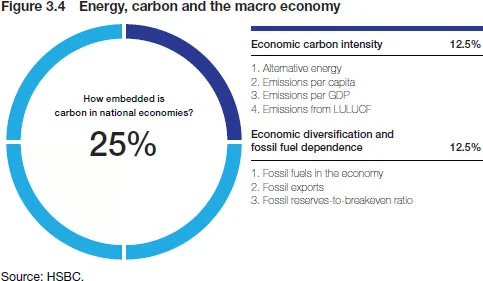
A range of data points55 This methodology is taken from Ashim Paun, Lucy Acton, James Pomeroy and Tarek Soliman, “Fragile Planet: The Politics and Economics of the Low-carbon Transition,” HSBC (10 April 2019), with updated data points. are reviewed, allowing us to analyse, at the country level, which countries are systemically more carbon-intensive and which are more exposed to the risks that economic dependence on fossil fuels brings. In other words, it helps detail which countries have higher transition risk (Figure 3.4 lists the full range of metrics utilised here).

The findings show European countries dominating the list with lower transition risk. The UK has low emissions per GDP, France generates the vast majority of its power from nuclear reactors, while Romania has built more hydro power and scores well on emissions relating to its sizeable, largely intact, forests. At the other end of the spectrum, the oil-rich Gulf States dominate due to their dependence on oil and gas for both economic output and domestic energy supply.
Economic diversification and fossil fuel dependence
Many scenarios for how the energy system might evolve see peaks in coal, oil and gas consumption in the coming years or decades. Achieving diversification is key to mitigating these downside risks. Looking at the extent to which the 67 countries are diversified in relation to fossil fuel, their exports and their economic production, overall EM and FM countries are on average notably more exposed to fossils. Fossil fuel exports in 2018 comprised 4% of GDP and 15.3% of total export revenues in EM and FM countries on average, compared to 1.7% and 8.6%, respectively, in DM. In terms of institutional indicators, the following were assessed: fossil fuels in the economy (level and change); fossil exports (level and change); and the ratio of reserve to breakeven prices in 2030.
Climate risks and adaption
The impact of climate change is already here – for instance, in 2020 we have witnessed serious floods in Indonesia and wildfires in Australia. Although MENA countries are the hottest (and driest), the temperature has risen faster in Eastern Europe in recent decades. Air pollution is also highest in the cities of Pakistan and India, while Southeast Asia has suffered the impacts of extreme weather events much more acutely.
Living with climate impacts
The impact of climate change is no longer a future risk. This is reflected in the scientific evidence, which shows rising temperatures in the majority of countries, changes to the hydrological cycle leading to water scarcity, and increasing severity and frequency of extreme natural events. Almost all regions were affected by significant weather events in 2019, and records are now seemingly quickly being broken in succession all around the world. The effects of these record-breaking events go beyond physical damage, and highlight the inadequacy of the social infrastructure and welfare mechanisms in many areas.
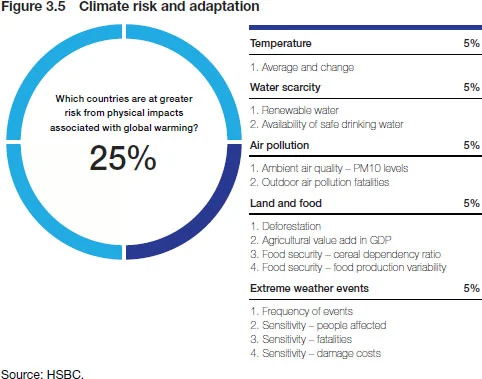
The rise in such impacts and the need to adapt to them has become more prevalent on the global climate policy agenda (see Figure 3.5). A key pillar of the Paris Agreement captures this: “Increasing the ability to adapt to the adverse impacts of climate change and foster climate resilience and low greenhouse gas emissions development, in a manner that does not threaten food production.”
This brings us to the next major question: “Which countries are at greater risk from physical impacts associated with global warming?” To answer this, we examine metrics that explore warming temperatures, water scarcity, air pollution, deforestation and food security, and extreme weather events. The Nordics do well again, as do other wealthy European nations. Although the US ranks reasonably well overall in this section (16th), it is placed a lowly 61st on both people affected and damage costs relating to extreme weather events over the past decade. At the other end of the table, EM and FM countries dominate: bottom-ranked Nigeria shows particular vulnerability in relation to water metrics, air pollution and land degradation, as well as on increases in sensitivity metrics on extreme weather events.

Policy and governance
Facing transition and physical risks, some countries are better placed than others to respond well. Western European countries dominate in this part of the analysis, as their resilience is supported by wealth, strong climate policies, effective government and strong democratic metrics (see Figure 3.6).
The climate response
We now move from the focus of the previous two sections – which essentially analysed the first two pillars of climate change, namely mitigating emissions and addressing the impacts – to analyse which countries are better placed to address climate risks. The key question here is “Which countries have the policy, institutional quality, financial strength and informed population to respond to climate risks?”


The wealthy Nordics again fare well in this part of the analysis, buoyed by strong showings on institutional quality and social indicators. At the other end of the spectrum, African and South Asian economies dominate.
Potential to respond to climate risks
Which countries are better placed to respond to the transition and physical risks analysed in earlier sections? This can be answered by looking at available capital, and which countries are stronger on institutional indicators as a guide to being well placed to use such capital:
-
-
wealth (level and change);
-
-
-
borrowing potential (level and change);
-
-
-
cost of capital (level and change);
-
-
-
sovereign wealth funds (level and change);
-
-
-
control of corruption;
-
-
-
rule of law;
-
-
-
inequality;
-
-
-
education;
-
-
-
media independence;
-
-
-
internet adoption;
-
-
-
mobile phone penetration.
-
Decarbonisation policy outlook
For the outlook on decarbonisation policy, we build on previous analyses by considering which countries have a stronger existing policy outlook for limiting GHG emissions. We use a point-scoring method for the pledges countries have made towards the Paris Agreement, incorporating the existence of long-term targets and carbon pricing schemes. Plus, the World Bank’s governance effectiveness indicators are used to understand in which countries governments are more likely to be able to turn policy into reality. This hinges on two main factors: their pledge on the Paris Agreement; and government effectiveness.
Green opportunities
With climate change now high on the agenda around the world, there are increasing opportunities for investing to address the impact. Here, China tops the list with high and increasing revenues, and many companies adopting climate policies. Patents granted in relevant industrial areas are an indicator of innovation – Japan and the US top these ranks.
Greater resilience through climate revenues
Displaying resilience through the low carbon transition is not only about being better placed to transition away from high-carbon activities or having the policy outlook to move away from fossil fuels. Such transition should be viewed as an opportunity for those able to sell the products and technologies that allow it to happen. Indeed, those countries that can generate more revenues as the global economy decarbonises are likely to be among the most resilient.
Climate change revenues
Looking at national exposure to revenues from climate change themes, countries will benefit as their companies earn revenues from products and services that enable the low carbon transition. To achieve this, we analysed revenues earned by publicly listed companies incorporated within countries using the HSBC’s proprietary Climate Solutions Database (HCSD).66 The HCSD only covers publicly listed companies and excludes private and state-owned enterprises, and so is only a partial analysis of total climate revenues available to countries (see Box 3.2).
Using the HCSD, we calculated the total climate revenue of the 67 countries for the year 2017/18, and looked for interesting trends in climate integration. The climate revenues of companies in these markets were aggregated to compute their overall climate revenue exposure, enabling us to compute markets’ absolute climate revenues and their climate revenue growth rates. Separately, we also re-ran the exercise to compute the climate share of revenues to the total GDP of markets, and to examine how the share of climate revenues in countries’ GDP has evolved.
The cleantech growth opportunity
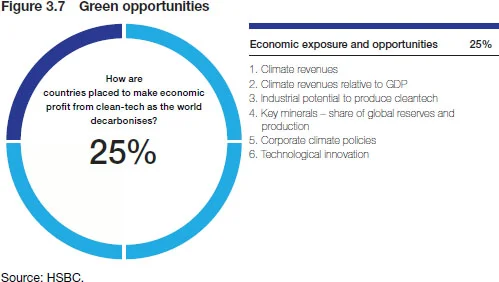
Combatting specialisation means achieving diversification, but the type of diversification achieved is also important. Diversifying within oil production gives some protection against local cost and depletion factors, so diversification should occur in non-hydrocarbon sectors, particularly for economies that are dependent on fossil fuels. Furthermore, in the coming years national diversification should benefit from expansion into climate-themed products and services (see Figure 3.7).

Mineral endowments
As sectors decarbonise over time, this will bring about an energy transition, entailing a reduction in the use of fossil fuels to generate energy in favour of electrification. In forecasting for the cost-optimal pathway to achieving an emissions trajectory consistent with limiting global warming to 2ºC at century end, we see global power demand to be about 2.5 times higher in 2050 than it is today. In addition, given that the ambition is to limit GHG emissions, power will increasingly need to come from renewable resources.
Corporate climate planning
As well as countries having cleantech production and the technologies needed to decarbonise, we also examined evidence of companies setting policies to address climate change and patent data for sectors where technologies may be relevant to the low carbon transition.
Final rankings
To recap, this chapter has looked at four areas and in each tried to address one crucial question:
-
-
How embedded is carbon in national economies?
-
-
-
Which countries are at greater risk from physical impacts associated with global warming?
-
-
-
Which countries have the policy, institutional quality, financial strength and informed population to respond to climate risks?
-
-
-
How are countries placed to make economic profit from cleantech as the world decarbonises?
-
We focused on answering these questions and building an overall picture of resilience versus vulnerability using 35 indicators – of which 12 are new – explored via 54 data points for each country. This enabled the ranking of 67 DM, EM and FM countries on their resilience or vulnerability in relation to an overarching question: “Which countries are most resilient in the face of rising climate risks?” In the final rankings, all four Nordic countries are in the top 10. The US and Canada place well overall, while New Zealand and Australia also rank in the top quartile.
We break these into four quartiles – the Czech Republic (17th place) is the only non-DM country in the top quartile. China (18th) and Korea (19th) are the next best-placed EMs. Chile is the best-placed Latin American country, in 25th. Eight MENA countries are in the bottom quartile, and the other five in the third quartile, with Israel the lowest ranked DM, in 31st. This shows that, in the short, medium and long term, all countries face climate risks of different types and will need to build resilience in this changing world.
There are levers that can be pulled to encourage lagging economies, including trade conditionality. Meanwhile, transfer of finance, technology, policy expertise and information can also help less-developed countries and those that face greater risks. These will all form part of the climate response of the 2020s. Consideration of all four areas of this analysis – transition risks, physical impacts, the potential of countries to respond and the green opportunity set – are essential to understand resilience at the country level.
Box 3.2 HSBC Climate Solutions Database
The HCSD comprises global companies that are focused on addressing, combatting and developing solutions to offset and overcome the effects of climate change, thus enabling the transition towards a low carbon economy. The HCSD includes companies with varying levels of exposure to climate-related businesses and defines investment opportunity set within the climate change space. We believe companies in the HCSD are best placed to profit from the challenges of climate change.
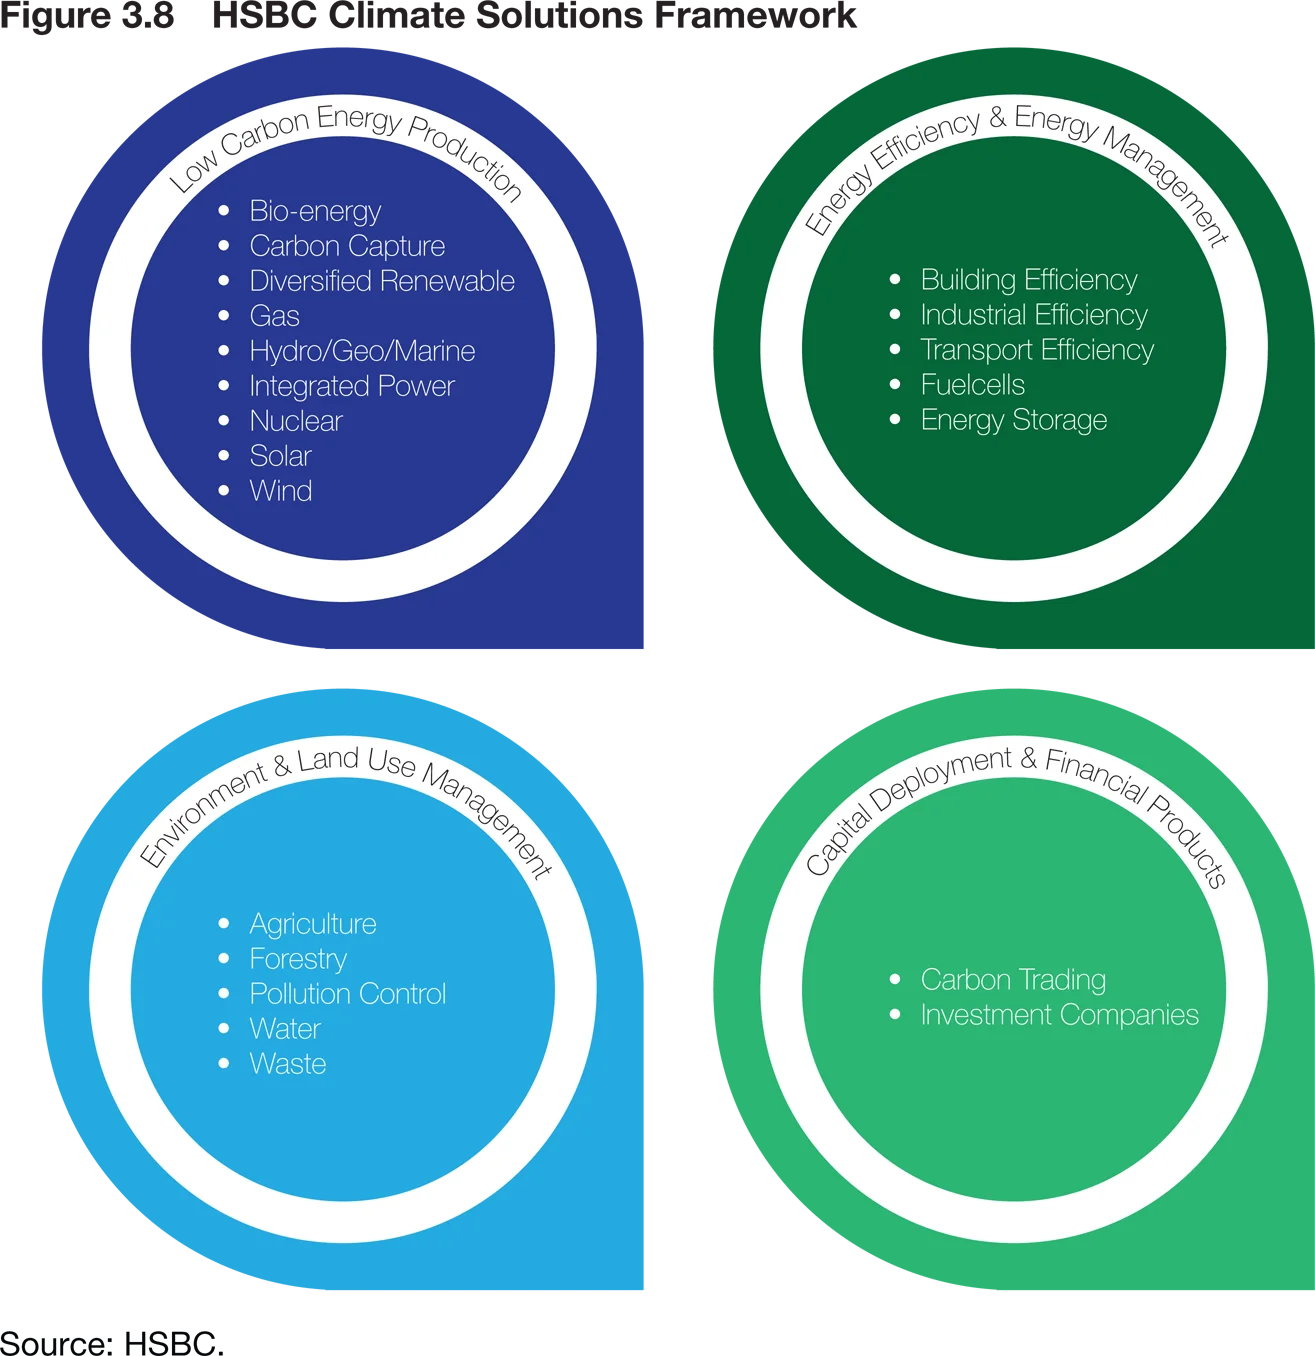
It is possible to then use the HSBC Climate Solutions Framework to screen the HCSD for companies that offer solutions – products and services – that have significant exposure to activities that help fight climate change. The framework defines four climate sectors, as per Figure 3.8.
The HCSD was launched in 2007 and currently consists of over 3,000 global companies across all major regions and markets. The climate exposure of companies in the HCSD is determined based on the proportion of revenues that these companies derive from climate change-related solutions. Climate revenues are mapped across four climate sectors, 21 climate themes, over 70 climate sub-themes and almost a 100 fourth-level classifications.
Companies’ revenues are monitored on an annual basis and their climate exposure factors are revised, if necessary, depending on changes in their relevant exposure to climate change-related activities. The database allows for identifying trends in climate integration across various climate themes, as well as across regions and countries. It therefore enables screening for markets based on their highest and lowest share of climate revenue as a proportion of macroeconomic variables, such as GDP. It also helps in identifying countries with relatively higher or lower rate of change in climate integration compared to other markets.
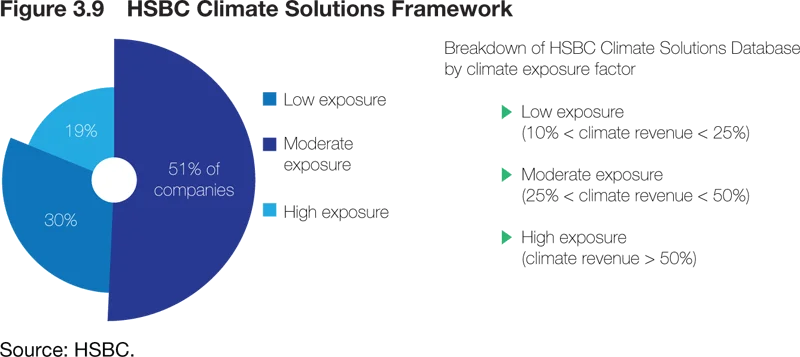
After detailed climate revenue mapping, companies in the database are assigned with an HSBC climate factor based on their climates revenues as a percentage of total revenues. Figure 3.9 shows a breakdown per level of revenue. Around half of companies in the database fall into the middle band of 25–50% revenue exposure. Companies are also assigned one climate sector and theme based on their largest exposure to those climate sectors and themes.
In terms of geographic breakdown of revenue sources, there are notably more companies drawing revenues in the Asia–Pacific region, with Europe and North America at similar levels to each other, although listed companies are typically larger in Western markets.
Conclusions
The integration of ESG criteria into central bank portfolios is clearly gaining pace, although taxonomy and the availability and consistency of data are still evolving, making this a challenging task for reserve managers. Nevertheless, there have been many striking initiatives taken by central banks, both individually and collectively. A few examples (out of many) in the past couple of years are listed below to illustrate:
-
-
The setting up and rapid expansion of the Network for Greening the Financial System (NGFS).
-
-
-
Bank for International Settlements (BIS) ESG corporate bond and green bond funds.
-
-
-
Introduction of responsible investment charters by the Banque de France and the central bank of the Netherlands.
-
-
-
Exclusion of Australian states and Canadian provinces with large climate footprints by the Swedish central bank.
-
-
-
ESG integration into equity portfolios at the Bank of Italy.
-
-
-
Hungarian National Bank’s green bond programme.
-
-
-
Hong Kong Monetary Authority’s inclusion of ESG factors in the selection, appointment and monitoring of external managers.
-
Central banks are clearly in a unique position to influence and lead by example in the way they adjust their portfolios to climate risk. Whether this will, or should, be an objective for monetary policy and consequently monetary policy portfolios is an ongoing and lively debate. We hope this analysis and the modelling of how to assess the climate risk of countries will add to the toolkit of reserve managers as they develop their ESG strategies.
Only users who have a paid subscription or are part of a corporate subscription are able to print or copy content.
To access these options, along with all other subscription benefits, please contact info@centralbanking.com or view our subscription options here: http://subscriptions.centralbanking.com/subscribe
You are currently unable to print this content. Please contact info@centralbanking.com to find out more.
You are currently unable to copy this content. Please contact info@centralbanking.com to find out more.
Copyright Infopro Digital Limited. All rights reserved.
As outlined in our terms and conditions, https://www.infopro-digital.com/terms-and-conditions/subscriptions/ (point 2.4), printing is limited to a single copy.
If you would like to purchase additional rights please email info@centralbanking.com
Copyright Infopro Digital Limited. All rights reserved.
You may share this content using our article tools. As outlined in our terms and conditions, https://www.infopro-digital.com/terms-and-conditions/subscriptions/ (clause 2.4), an Authorised User may only make one copy of the materials for their own personal use. You must also comply with the restrictions in clause 2.5.
If you would like to purchase additional rights please email info@centralbanking.com


