Implementing a corporate bond portfolio: lessons learned at the NBP
Juliusz Jabłecki and Magdalena Zielińska
Foreword
The cashless society?
Executive summary
Trends in reserve management: 2019 survey results
Implementing a corporate bond portfolio: lessons learned at the NBP
Sovereigns and ESG: Is there value in virtue?
A methodology to measure and monitor liquidity risk in foreign reserves portfolios
Reserve management: A governor’s eye view
How Singapore manages its reserves
Appendix 1: Survey questionnaire
Appendix 2: Survey responses and comments
Appendix 3: Reserve statistics
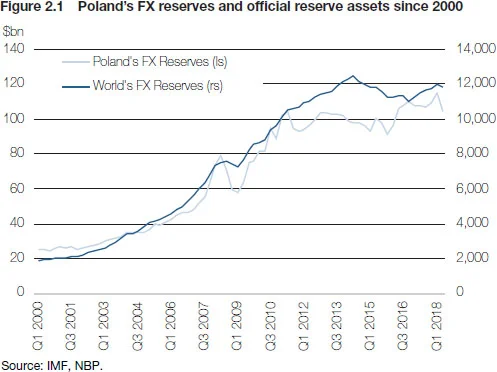
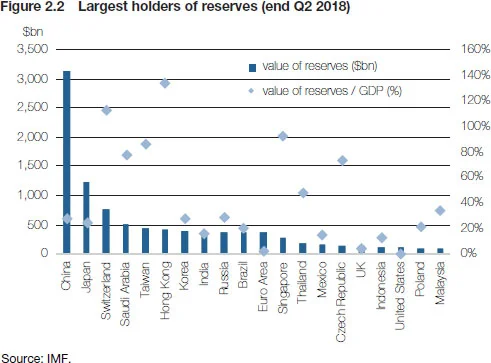
Over the past two decades, the foreign exchange reserves portfolio of the Narodowy Bank Polski (NBP) has grown roughly in line with the growth in global reserve assets. By the end of October 2018, FX reserves – assets denominated in foreign currencies, mainly in the form of securities, deposits and repo/reverse repo transactions – had reached the equivalent of $105.3 billion, about 20% of GDP, securing Poland’s position among the 20 largest global reserves holders (see Figure 2.1).
However, with virtually no FX interventions and a floating exchange rate, the key factor driving reserves accumulation over the past decade has been the inflow and off-market conversion of European Union funds. This systematic, largely exogenously driven growth in NBP’s balance sheet has coincided with a general fall in yields on most traditional asset classes following the global financial crisis in 2008. The low interest rate environment has encouraged asset managers and institutional investors to look more actively for ways of enhancing investment returns.
At NBP this process involved first and foremost a gradual diversification away from the initial three currency portfolio – made up of US dollars, the euro and pound sterling – into a progressively broader currency spectrum. By 2017 this had also featured Australian dollars, New Zealand dollars, Norwegian krone and, briefly, even the Mexican peso and the Brazilian real (see Figure 2.2). Another dimension of the diversification process consisted of acquiring exposure to asset classes other than the standard sovereign bonds that had been up to then, and to a large extent continues to be, the main investment vehicle owing to their superior safety and liquidity (see Box 2.1).
In 2012, the board greenlighted a decision to allocate a part of NBP’s US dollar portfolio to high-grade corporate bonds (see Box 2.2). In terms of timing, the US economy seemed to have finally regained a solid footing after the subprime crisis, and while the Treasury yields remained low risk perception had come down sufficiently to render high-grade corporate credit an attractive yield enhancement product. Perhaps unsurprisingly, by 2012 corporate bonds had already been in the spectrum of investable securities of a number of central banks.
Box 2.1 Institutional context for managing reserves at NBP: Priorities and decision-making
Pursuant to the Act on NBP of 1997, the central bank holds and manages FX reserves, aiming primarily to ensure the high safety and necessary liquidity of invested funds, and – with these priorities satisfied – to maximise returns in given market circumstances.
From an operational point of view, reserves are managed within a three-step process, comprising strategic, tactical and portfolio management perspectives. The first step of the process is the approval by the management board of the strategic asset allocation (SAA), or strategic benchmark, which sets the key parameters of the long-term investment strategy in accordance with the board’s risk/return preferences. The SAA framework is normally reviewed on an annual basis to ensure that a wide range of up-to-date macroeconomic and financial forecasts can be used in the underlying optimisation exercise.
On a general level, the review provides key strategic parameters, in particular the currency structure and modified duration with their corresponding ranges for deviations that determine the scope of active management for tactical asset allocation and active portfolio management. Against such a background, the FX investment committee is responsible for tactical asset allocation (TAA), whereby it tries to take advantage of medium-term market developments not foreseen in the strategic benchmark with a view to outperforming the SAA. Finally, portfolio managers take active decisions on a day-to-day basis, striving to outperform the tactical benchmark.
The initial exposure was set at $500 million, which corresponded to roughly 1.6% of the US dollar portfolio at the time and 0.6% of total FX reserves. The size limit was considered big enough to be financially meaningful in an overall portfolio context but at the same time conservative enough given our relative inexperience with the new asset class. An important consideration was that we wanted to develop in-house expertise, and thus it was decided that the corporate portfolio would be built and managed internally.
Box 2.2 First US corporate bond portfolio at NBP: Investment process (2012–16)
-
The initial size of the exposure towards the US corporate bond market was to be determined by the board, subject to annual review, based on analysis of market conditions presented by the Financial Risk Management Department (FRMD) situated in the middle office.
-
Corporate securities would then be purchased by the front office within credit risk limits set by the FRMD (the limits determined both the maximum share of non-government securities in the total reserves portfolio and those for individual issuers), which would also be responsible for ongoing monitoring of the underlying investment risk.
-
General assumptions of the investment strategy would be reflected in the benchmark and reviewed annually. The board would approve a level of portfolio modified duration and the industry sectors to be included in the benchmark. However, the composition and principles of benchmark rebalancing would be determined by FRMD.
-
The minimum required credit rating would be specified by the board in a resolution on the management of foreign exchange reserves.
-
Corporate bonds would be classified as a “lower liquidity portfolio” and constitute a separate tranche from the investment portfolios subject to the three-step investment process.
-
Information on the rate of return and risk exposure of the corporate bond portfolio would be included in the standard reporting process; however, given the learning process underway, excess return on the corporate bond portfolio would not be included in the overall excess return on actively managed investment portfolios.
From the outset, we wanted to design the investment process around some sort of benchmark portfolio that would express our main investment guidelines. The initial discussions suggested there were two general ways to go about creating a benchmark:
-
-
a broad benchmark containing all bonds meeting certain objective criteria (such as an approved list of issuers, selected industry sectors, minimum level of amount outstanding and specified maturity), and in practice implying active portfolio management;
-
-
-
a narrow benchmark with limited number of bonds, encouraging passive portfolio management and allowing for straightforward benchmark replication
-
Given the considerable uncertainty about the liquidity of corporate bonds, their different characteristics (as compared to Treasuries), as well as the learning process underway, the board finally opted for the safer option of a narrow benchmark, thus by extension approving a passive approach to the design and implementation of the corporate bond portfolio (see Box 2.3).
Box 2.3 Construction of the first benchmark dedicated to US corporate bond portfolio management
The board’s resolution on the corporate bond benchmark involved the following.
-
-
The initial level of benchmark modified duration was set at 2.9 with a band for deviations of ±1.0
-
-
-
The actual modified duration of the benchmark was to be determined by the composition of bonds included therein, and would gradually fall until the next benchmark review as bonds matured over time
-
-
-
The benchmark composition would include securities issued by companies from the pharmaceutical; chemical and mining; and energy and technology sectors
-
The composition of benchmark was as follows.
-
-
The initial benchmark was designed as a two-dimensional object, one representing the weights of four maturity baskets (1–3Y, 3–5Y, 5–7Y and 7–10Y) and the other the weights of the three industry sectors. This gave us 12 buckets to fill, with the share of each bucket in the benchmark equal to the product of the weight of a given sector and that of a given maturity basket
-
-
-
To fill the buckets, we first came up with a list of approved issuers (first and second choice) and the list of bonds issued by these issuers.
-
-
-
All buckets were then filled with bonds from the selected list subject to the certain conditions:
-
each bucket could contain no more than two bonds, and no bucket could be left empty;
-
bonds issued by all first-choice issuers were to be included in the benchmark, and no more than two bonds issued by one issuer were to be included;
-
bullet bonds were given preference over callable bonds, as were bonds with high (versus low) amount outstanding and high (versus low) coupons.
-
-
However, shortly after determining the benchmark composition, the first problems emerged. Apparently, the front office had been unable to purchase some bonds from the list provided, which – given the relatively narrow benchmark in place – had effectively forced them into unwanted credit and/ or market exposures. This, in turn, prompted us to review and amend the composition of the benchmark. Faced with such a challenge, we followed what seemed to be the most practical solution: the front office, being closest to the market, would come up with suggestions of different, liquid bonds as potential benchmark candidates. These bonds would then be vetted by the FRMD, and if they satisfied the basic criteria laid out in Box 2.3 would be included in the benchmark. The same procedure was applied whenever a bond included in the benchmark reached maturity.
Over time, the index and our portfolio evolved as duration and other parameters changed in response to market conditions. Overall, the performance of the corporate bond portfolio since inception to 2017 was viewed as satisfactory as it had easily outperformed our US Treasury portfolio, providing the yield enhancement sought. However, the investment process seemed in some ways deficient, or at least overly complicated relative to its substantive sophistication.
In particular, although considerable time and energy had been invested in creating a narrow yet objective index – for the sole purpose of ensuring easy replication – replication often proved difficult, and in any case certainly not straightforward due to unexpected liquidity disruptions in the market. This is where the law of unintended consequences came to haunt us, because, with relatively few issues in the benchmark to begin with, the inability to replicate by taking positions in all index constituents could produce considerable unwanted (and difficult to hedge) risk exposures, a phenomenon one would not expect with a broad benchmark. Attempts to fix the problem by substituting missing issues proved time-consuming and operationally burdensome. Moreover, the remedy may have also to some extent blurred the lines between risk takers and risk managers, progressively eroding the objective character of the benchmark, which effectively drifted towards whatever portfolio considerations dictated.
A major remap and overview of NBP’s new corporate bond index
By 2016 it had become clear that the old ways needed to change. With almost four years of experience in the corporate bond market, we felt the time had come for a more active and sophisticated approach to portfolio management. This was to be facilitated first and foremost by integrating the corporate bond portfolio (so far classified as a separate “lower liquidity” tranche) with the rest of the US dollar portfolio and bringing it within the confines of the three-step investment process, with strategic, tactical and portfolio-level decisions. An integrated portfolio was meant to give traders a greater degree of freedom as they would now be able to not only take positions vis-à-vis the benchmark, but also play on the scale of relative exposure to corporate credit against Treasuries (within limits). Moreover, such an approach would make it easier to consistently assess both the investment risk and the value added of active credit portfolio management. The plan was finally greenlighted in September 2017, with the board approving a 2% allocation to corporate bonds within the strategic asset allocation to US dollars.
At that point, all that remained was to determine an optimal way to include corporate bonds into the benchmark portfolio in US dollars. Taking into account the overarching desire to broaden the spectrum of investments in the corporate bond market – ie, acquiring more general credit market exposure – and to pursue a more systematic, active investment strategy, we have decided to adopt a benchmark based on a market index of corporate bonds.
Market indices are objective and transparent; they are constructed using clearly defined rules, and above all are designed in a way to provide a representative overview of a given market, reflecting its profitability and risk. The nature of the index depends on the restrictiveness of the criteria adopted in its construction. A wide range of indices – readily available from different providers – allows investors to choose a product tailored to their investment policy, risk tolerance and other requirements. Indices are also widely used in the analysis of the effectiveness of the investment policy pursued.
Thus, the main assumption underlying the search for a proper index was objectivity and market representativeness. We wanted to keep all the major characteristics of the US corporate bond market and at the same time to incorporate rules and constraints of our own investment guidelines. As finding a readily available index that would fulfill all our requirements proved impossible at the beginning of 2018, we set out on rounds of negotiations with index data providers regarding the possibility of creating a market index tailored to NBP’s needs. Such a tailor-made index would have to include additional criteria to ensure adequate creditworthiness of issues and issuers and exclude industries not consistent with our ethical standards.
Perhaps unsurprisingly, we have quickly learned from providers that the technical possibilities of incorporating our criteria are quite broad but not unlimited. In particular, we have come to realise it would not be possible to implement our sophisticated credit assessment model within the index infrastructure – so that “NBP-complaint” and “non-compliant” names could be automatically screened based on in-house credit scores – and some compromise had to be found. This entailed finding the right balance between the representativeness of the index and the operational capabilities of monitoring issuers and market analysis of instruments. Our working assumption has always been that portfolio managers should be able to take a position in each benchmark issue, and that meant in turn that each issuer included in the benchmark had to have a credit limit – which, of course, meant that benchmark members would have to be screened and evaluated on an ongoing basis.
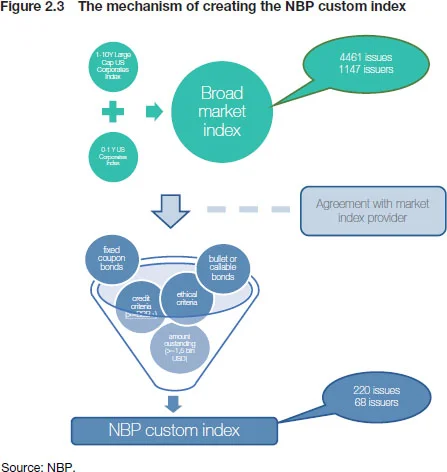
As a result of this work, in the first half of 2018 an index was finally selected and adjusted to the needs stemming from our overall investment guidelines. The final benchmark index composition comprised 68 issuers and 220 issues, and in July 2018 the new corporate bond index was included in the US dollar strategic benchmark with a share of 2% (see Figure 2.3).
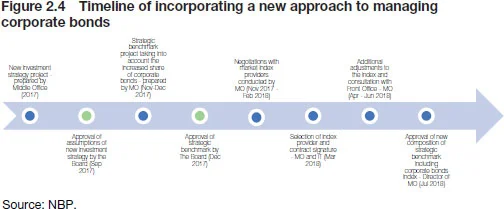
In response to changes in the composition of the strategic benchmark, the front office promptly started making the first purchases of corporate bonds in the new regime, gradually increasing their share in the US dollar portfolio from 0.9% to the benchmark level of 2% by September 2018. Once the portfolio had been built, the adjustment period ended and the excess return calculation was included in the US dollar portfolio statistics (see Figure 2.4).
Despite evidently a lower number of issues, the industry structure of the NBP index seems to reflect the composition of the market index quite closely, albeit with some important differences. Specifically, more than 30% of the broad market index is made up by issuers from the banking sector that have been completely excluded from the NBP index. The rationale behind that step was to avoid a potential concentration of exposure to the credit risk of financial institutions already generated by investments on the interbank deposit market. With banking sector issuers cut out, the NBP index overweighs bonds issued by corporates representing the technology and electronics sectors. Still, leaving aside both outliers, the contributions from the remaining sectors to the broad market index and the NBP index tend to be similar.

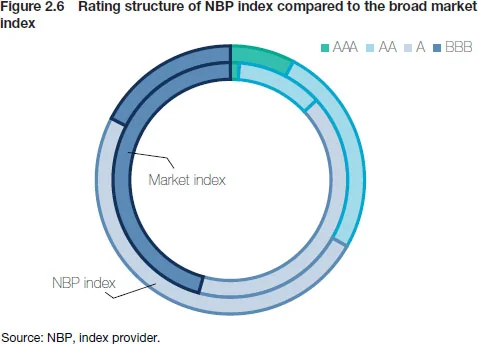
At the same time, the average credit rating of the NBP index is higher than for the broad market index. Due to the imposition of our more restrictive criteria, the share of the lowest rated issues in our index is much lower than in the broad market index, while the share of the AAA-rated issues is higher (see Figures 2.5 and 2.6).
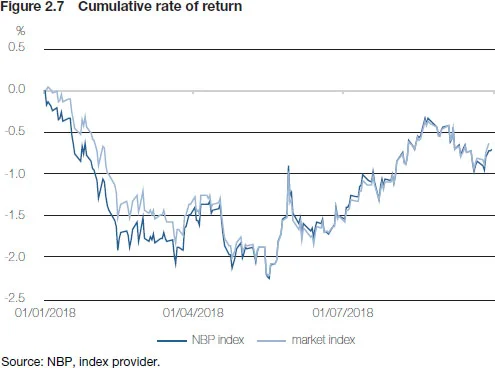
Despite the lack of a long history of the NBP index, it can be concluded that returns of the NBP index are very highly correlated with the returns of the market index (ca. 0.96), indicating that – despite the various discretionary adjustments – the NBP index fairly accurately represents the trends in the investment-grade corporate credit space in the US (see Figure 2.7).
Lessons learned
In this section we present, in a hopefully concise and digestible way, some of the practical lessons we have learned while implementing and ultimately using our corporate bond benchmark index. While we are certainly happy with the changes to our reserve management set-up and overall progress, we nonetheless feel a little bit like the students who reportedly posted this note outside the mathematics reading room at Tromso University:11 From Bernt Oksendal, Stochastic Differential Equations. An Introduction with Applications (New York: Springer).
We have not succeeded in answering all our problems. The answers we have found only serve to raise a whole set of new questions. In some ways we feel we are as confused as ever, but we believe we are confused on a higher level and about more important things.
Hopefully, the discussion below will be helpful to others embarking on the project of building a corporate bond portfolio of their own.
Lesson 1: Corporate credit is (almost) all about credit risk…
To borrow from Neil Armstrong, going from a pure Treasury bond portfolio to one with a non-trivial allocation to corporate bonds may well be a small step for a finance aficionado but is in many respects a giant leap for the institution and its senior decision-makers. After all, corporate credit is first and foremost about credit. Even if the exposure is only to investment-grade issues, the headline risk that a public investor needs to be mindful of – and the non-zero probability of a sudden default of even highly rated names – means that credit risk management functions will have to take on a considerable burden.
Indeed, in the case of NBP the new approach to managing corporate bonds has resulted in a significant increase in the number of issuers that need to be monitored on an ongoing basis. This raised both investment and operational issues. As the number of people in the credit risk team had not changed and increasing staffing solely due to the changed management style of corporate bonds – which after all remain just a fraction of the reserves portfolio – would prove a tough sell, we had to factor such limitations into our plans. Specifically, when designing the benchmark index we had to think in terms of how many entities we would realistically be able to cover, come rain or shine. This number – or, perhaps more accurately, range – proved an important determinant of the size of our corporate index, alongside more objective criteria stemming from NBP’s investment guidelines and the constraints discussed above.
To be sure, the increase in portfolio size has not only broadened the scope but also the complexity of the entire exercise, forcing our credit team to ponder questions such as: “how do we treat a ‘sukuk’ bond”, “what do we make of Company XYZ moving to the Cayman Islands”, or – most frustratingly – “why is there no info about that ticker on Bloomberg”?
Over and above such largely qualitative issues, changes also had to be made to the quantitative side of the risk assessment process through standardisation of the rating criteria and modifications to the credit limit system. The new limit methodology introduced the concept of a global limit, defining the maximum acceptable risk-weighted exposure to an entity.
Methods used so far limited credit risk at the level of individual transactions. With the expansion in the portfolio of names we had to deal with, and the associated rise in the spectrum of transactions, the lack of a global perspective of investments could result in excessive exposure to individual entities. In other words, without a global limit we could, in theory, be putting on exposures to the same entity through different transactions, limiting the exposure to those transactions as such but at the same time allowing our overall credit exposure to that particular entity to increase.
Simultaneously with the development of the new limit system, we have been developing new analytical tools and IT solutions supporting credit risk assessment. The move towards a more advanced IT environment was partly driven by the desire to have a system that would be fully aligned and consistent with our new methodology, but also by the natural concern to limit the operational risk involved with using less sophisticated solutions. However, for all its superiority, the new system still needs to be operated and supervised, and requires a full assessment of the creditworthiness of each issuer in the portfolio – both at the moment of setting a limit, and later on when monitoring its utilisation.
Lesson 2: … except when it’s about liquidity
From the very beginning, our discussions about developing a corporate bond portfolio have always centred around liquidity issues. This is because corporate credit is almost always about credit risk... except when it’s about liquidity. All analyses and market intelligence collected and conducted over the years have consistently shown that the US bond corporate bond market – while perhaps still liquid relative to other asset classes – is certainly not as deep and liquid as the Treasury bond market that we had greatest experience with. However, we were not sure exactly how, and to what extent, the expected lower liquidity would affect our portfolio – which, after all, had been designed in a way as to include mostly highly rated bonds with high amounts outstanding, issued by highly rated, big companies.
As mentioned, our first misadventure with liquidity occurred in the early days of our corporate credit investment journey. Unfortunately, the whole episode taught us more about the philosophy of benchmark construction than the real nature of the problem. Were the wrong criteria for selecting the instruments to blame? Or was it the wrong strategy of a too narrow benchmark? Or perhaps our lack of experience, bad timing, bad luck, or all factors together?
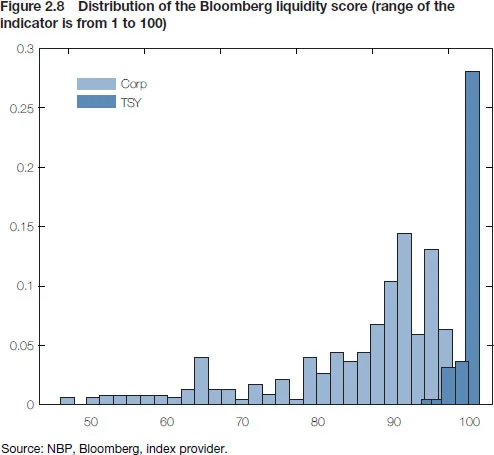
As our knowledge of the market expanded and our activity increased, we have gradually come to realise that although generally speaking liquidity does seem to be an issue, it no longer significantly constrains the management of our portfolio. Of course, the liquidity of corporate bonds is undeniably lower than that of Treasury securities in our US dollar portfolio (see Figure 2.8, which shows the frequency distributions of Bloomberg liquidity scores for both categories of instruments). Still, almost all issues included in the benchmark index are ranked above the median liquidity score in the peer group of government and corporate bonds.22 Based on the Bloomberg liquidity score.
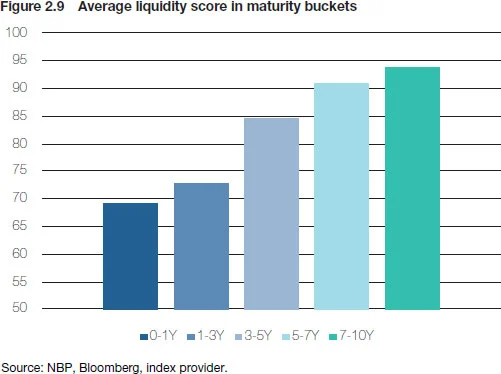
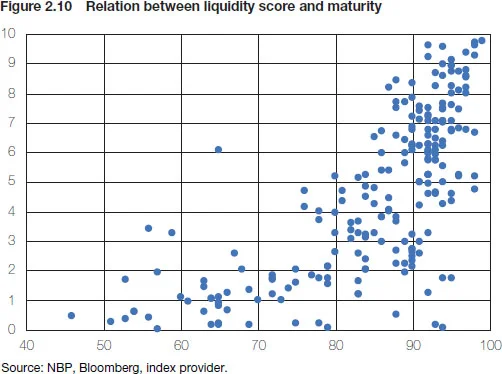
The most visible problem occurs in the case of bonds from the short end of the yield curve. Longer maturities seem to attract better liquidity scores, which is likely related to their greater abundance relative to short-term corporate paper (see Figures 2.9 and 2.10).
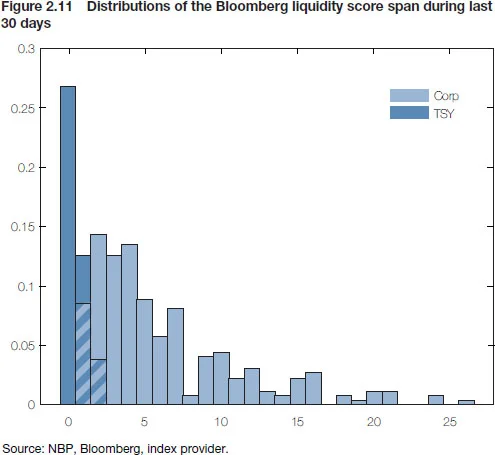
A more serious problem relates to the fact that the liquidity of individual corporate bonds is hard to predict and much less stable than that of the corresponding Treasury securities (see Figure 2.11). Indeed, it is not uncommon for liquidity scores of bonds in our portfolio to change by 20%, something that never happens for Treasuries. On the portfolio level, such liquidity disruptions need not present significant difficulties – and, in fact, may constitute potential profit opportunities (see Lesson 4) – but on the level of individual bonds they can lead to transitory frictions for which the front office has to be prepared.
One way to manage liquidity-related problems is through the use of simple derivatives. At the time of writing, we are exploring the introduction of bond futures into our corporate portfolio management strategy, as we have already found that resorting to futures contracts can be a very efficient way of managing duration exposure in our Treasury bond portfolio. We expect that corporate bond futures will help us reduce transaction costs related to managing interest rate exposure in corporates. The next steps along the way will include determining an optimal strategy for managing credit spread exposure, maybe using derivatives as well.
Lesson 3: Corporate bonds are a spread product … Or are they?
One of the standard motivations for gaining exposure to corporate bonds is to earn the so-called credit risk premium – ie, an excess return net of default losses over comparable duration risk-free bonds. Indeed, corporate bonds typically trade at a positive yield spread over comparable maturity Treasury bonds. The spread – which stands at roughly 130bp for a broad index of US credits – is due to the fact that a corporation, much more so than a sovereign government endowed with taxing power, might default before making good on its debt, leaving investors with recoveries well below par. Accordingly, it is the level and volatility of corporate bond spreads that many investors view as a key determinant for entering or exiting the market. Indeed, according to the results of a questionnaire published in Risk Management Trends 2018, public investors viewed corporate credit less favourably in 2018 due to a general “tightness of credit spreads.”
As a matter of basic financial algebra, a bond’s one-period holding return (net of credit losses) is made up of its yield and capital appreciation/depreciation due to changes in yield levels. Letting MD stand for modified duration, we can express this symbolically in the context of corporate bonds as:
However, since – as stressed above – the corporate bond yield equals the yield to maturity on a duration-matched government bond, YTM, plus a credit spread, s, the above equation actually becomes:
confirming the intuitive insight that when credit spreads are low, then so should be corporate bond returns. However, practical differences between the characteristics of the corporate bond portfolio and the government bond portfolio used as a benchmark to assess the efficiency of credit investments can make such simple textbook decompositions misleading. In particular, one thing we have found was that the spread risk on many occasions tends to be lower than the sensitivity to the risk-free curve. For example, the returns on our corporate benchmark since October 2017 (ie, when index history begins) are explained primarily by the returns on our US Treasury portfolio (see Figure 2.12).
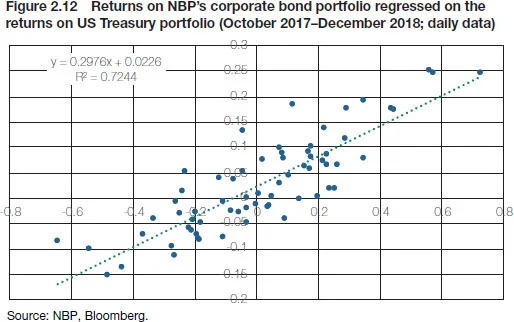
In fact, this seems to be a more universal pattern. Box 2.4 shows the results of a simple exercise in which we have regressed monthly total returns for the Bloomberg Barclays US Investment Grade index on the monthly changes in the average yield on a hypothetical US dollar Treasury index representative of our US dollar portfolio, and monthly changes in the spread between AAA- and BBB-rated corporate bonds. The “betas” on the two spreads represent empirical estimates of interest rate and spread durations, respectively. Over almost three decades, from 1993 to 2018, the spread duration of the corporate bond index was just –1.3, while its interest rate duration is –3.1. In words, a given shift in yields tended to affect corporate bond returns about three times as much as a corresponding change in credit spreads, which suggests that bond returns are likely to be largely driven by yield curve shifts.
Box 2.4 Empirical estimates of corporate bond duration
To assess the difference between spread duration and interest rate duration of a corporate bond portfolio, we regress the monthly returns for the Bloomberg Barclays US Corporate Investment Grade index, Rt corp, on the change in end-of-month yield spread between AAA and BBB issues, Δ(sAAA – sBBB), and the change in the average yield on the government bond index representative of our US dollar sovereign benchmark, ΔYTMt:
The sample runs from December 1993 to December 2018, giving 265 monthly observations. Coefficient estimates and t-statistics are reported in Table 2.1.
| Coefficient | t-statistic | |
| Intercept | 0.45 | 5.22 |
| ßspread | -1.3 | -6.5 |
| ßIR | -3.1 | -4.3 |
| Source: NBP, Bloomberg. | ||
However, there is even more nuance to this. Looking more closely at corporate bond returns and their volatility across the maturity spectrum, we have documented a somewhat counterintuitive result that the front end of the credit curve tends to systematically offer the best investment on a risk-adjusted basis (see Table 2.2).
| 1Y–3Y | 3Y–5Y | 5Y–7Y | 7Y–10Y | 10Y+ | 10Y–25Y | 25Y+ | |
| Mean | 1.02 | 0.89 | 1.11 | 0.47 | 0.38 | 0.55 | 0.03 |
| Std dev | 2.44 | 3.18 | 4.39 | 4.92 | 7.45 | 6.03 | 7.47 |
| IR | 0.42 | 0.28 | 0.25 | 0.10 | 0.05 | 0.09 | 0.00 |
| Source: NBP, Bloomberg. | |||||||
The return of investment-grade corporate bonds in the 1Y–3Y maturity bucket achieves an information ratio above 0.4, and deteriorates to just 0.05 and 0.004 for bonds with maturities beyond 10Y and 25Y, respectively.
Exactly why the short end of the spread curve overperforms so markedly is not clear. Mechanically, this seems to reflect the fact that credit spreads do not increase one-for-one with duration, so that bonds in farther maturity buckets pay disproportionally low spreads, perhaps as a result of some sort of market fragmentation. Be that as it may, we believe there is ample empirical evidence not to think of corporate bonds solely as credit spread products, with lots of room for classic duration-based plays within the broader activist approach to replication.
Lesson 4: Ins and outs of index replication
As should be evident, a constant theme of our internal discussions was how broad the prospective corporate bond benchmark should be. Recall that one of the ideas behind introducing a benchmark (together with the integration of the corporate portfolio within the SAA) has been to provide a framework for consistently measuring the value added to the investment process – so called “alpha”, or excess return – by portfolio managers. As such, a good benchmark should represent as closely as possible the risk and return profile of a given asset class, as well as satisfying three key conditions. First, it should be well defined, in the sense that it should be verifiable and free from ambiguity with regard to its contents. Second, it should be tradeable in the sense that taking positions in the whole index or some of its members should constitute a viable, implementable investment strategy. Finally, the index should be replicable since, without such a provision, portfolio managers might complain (rightfully so) about not being in the position to even generate the benchmark return, not to mention any alpha above it.
Of the three conditions, replicability proved the most contentious, revealing different perspectives of the stakeholders involved in line with their respective roles in the overall investment process. On the one hand, the risk function – being also responsible for strategic asset allocation – was primarily concerned with ensuring a truly representative character of the index. Accordingly, it pushed for as broad a composition as possible within the accepted risk and investment guidelines. On the other hand, portfolio managers were concerned that the broader the index, the less liquid and tradeable its constituents and thus, by extension, the more difficult its replication would be.
Extensive discussions and several iterations of internal memos revealed that at the heart of this “tug of war” was a fundamentally different understanding of replication that, once happily resolved, left both sides feeling they had been right all along. The crux of the matter is that replicating an index does not need to entail taking positions in all constituent bonds. While such passive replication should be at least theoretically possible, it may not be the most effective approach. Indeed, trying to passively replicate a broad index that is truly representative of an asset class – in this case, the investment-grade corporate bonds universe – would entail significant operational costs in monitoring and risk managing individual issuers. However, replication can also be seen as essentially an engineering or optimisation exercise whereby portfolio managers seek to reproduce the main features of the entire benchmark – duration, credit risk profile, etc – by selectively positioning in a much fewer number of bonds, saving transaction and risk management costs. With such an approach, a credit limit would perhaps not even have to be assigned to each individual index member, and portfolio managers would be motivated to engage in more active strategies.
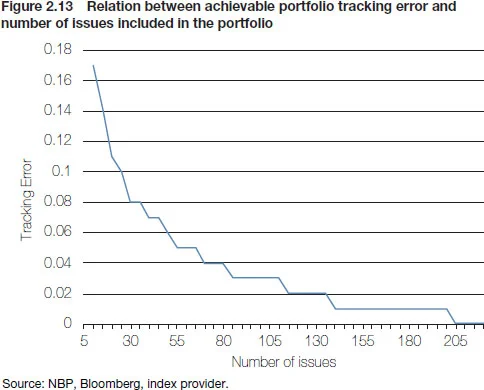
Simulations performed using data on our benchmark index returns and composition over the period January 2018 to September 2018 show that such an active approach to replication is indeed feasible (see Figure 2.13). In particular, a portfolio of 80 carefully selected bonds (out of 220 in the benchmark) is capable of bringing the tracking error to an impressively low number of 0.03%.
In practice, the tracking error of the NBP’s portfolio with respect to the benchmark tends to be considerably greater – around 0.30% – but, to borrow from accounting jargon, it is an error of commission not omission. In other words, portfolio managers have so far purposefully strived not to replicate the index in its entirety, putting on positions leveraged on the insights from Lesson 3 on the overperformance of the front end of the credit curve. Indeed, a decomposition of the tracking error shows that it resulted almost entirely from lower interest rate duration with only a minor contribution from the spread duration effect (see Table 2.3). Put simply, our effective portfolio had significantly lower duration than the benchmark, while preserving similar sectoral composition and credit profile. With tight and generally flat credit spreads, and an environment of rising interest rates, this has produced a healthy excess return of 60bp.
| NBP portfolio | NBP customer index (benchmark) | Broad market index | |
| YTM (%) | 3.31 | 3.45 | 3.87 |
| Modified duration | 3.64 | 4.24 | 4.21 |
| Credit spread | 45 | 56 | 91 |
| NBP portfolio vs NBP custom index (benchmark) | NBP portfolio vs Broad market index | NBP custom index (benchmark) vs Broad market index | |
| Tracking error | 0.33 | 0.33 | 0.28 |
| – Impact of yield curve | 92.6% | 43.0% | 2.1% |
| – Impact of the credit spread | 3.1% | 55.0% | 91.9% |
| – Non factor | 4.3% | 2.0% | 6.0% |
| Source: NBP, Bloomberg, index provider. | |||
Lesson 5: Why corporate bonds are not the end of the story
The process of constructing the corporate bond benchmark from scratch and then collaborating with the front office on creating an actual revamped portfolio (accounting now for 2% of the total US dollar portfolio) has forced us to not only consider a myriad technical issues, but also rethink some broader, more philosophical questions, such as: what role should corporate credit ultimately play in our overall strategic asset allocation, and – related to that – how big should our corporate bond portfolio eventually become?
To frame these questions – and our tentative answers – in a proper context, consider once again the historical performance of corporate credit. On the face of it, corporate bonds present themselves as superior investments since they offer a hefty spread over Treasuries. Indeed, as mentioned, the option-adjusted yield spread between the broad corporate bond index and duration-matched US Treasury securities has averaged about 1.30% since the 1980s. Correcting the spread for average default losses, estimated at about 0.20% for investment-grade credits, still leaves a decent 100bp.33 Moody’s Investor Services, “Corporate Default and Recovery Rates, 1920–2010” (February 28, 2011).
Interestingly, however, the ex ante yield spread tends to markedly exaggerate ex post returns differences. Indeed, in the long period between 1988 and 2018 the excess return of the Bloomberg Barclays Investment Grade index over a hypothetical duration-matched US Treasuries portfolio averaged 0.54% with a standard deviation of 3.80% – ie, just about half of the ex ante yield spread, net of credit losses (see Figure 2.14). Notably, for baskets made up of the highest-rated credits the performance looks considerably less attractive, with an average excess return of a mere 0.08% for Aaa- and 0.35% for A-rated names. This finding seems to be broadly consistent with the empirical literature as academic studies have typically found that investment-grade credit portfolios have generated an average annual spread premium of between 30 and 50 basis points per annum over US Treasury bonds.44 See, for example Kwok-Yuen Ng, and Bruce D. Phelps, “Capturing Credit Spread Premium,” Financial Analysts Journal 67.3 (2011): 63–75; David F. Swensen, Pioneering Portfolio Management: An Unconventional Approach to Institutional Investment (New York: Free Press); Antti Ilmanen, Expected Returns: An Investor’s Guide to Harvesting Market Rewards (Chichester: John Wiley & Sons, 2011).
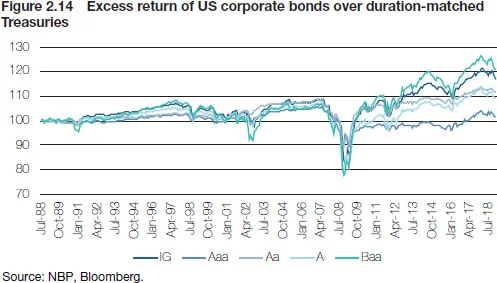
A glass half-full perspective would be that, while somewhat short of the yield spread, the long-run excess return is still noteworthy, especially when contrasted with the typical excess return over the SAA allocation delivered through active management. According to a less sanguine – or perhaps more realistic – view, however, the excess return should be traded off against the cost associated with putting up with three key hurdles associated with holding a position in corporate bonds: (i) credit risk; (ii) inferior liquidity; and (iii) callability. The first two of these were treated above to some extent. In particular, Lesson 1 looked at the non-trivial costs of managing credit risk in terms of both financial and organisational capital, while Lesson 2 complemented the discussion with a deeper look at corporate bond liquidity issues.
Box 2.5 Optimisation analysis
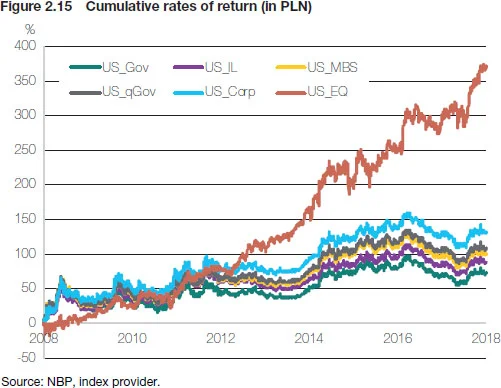
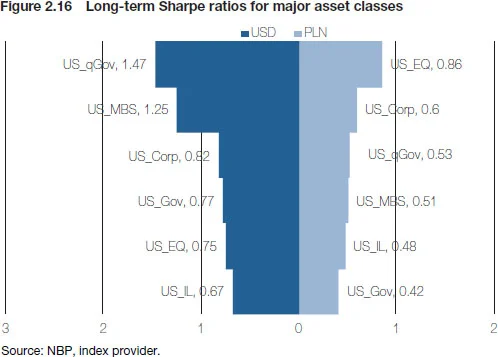
To quantitatively assess what the optimal share of corporate bonds in a portfolio should be – as judged by the Sharpe ratio – we compare the results of three different optimisation strategies with different constraints (see Figures 2.15 and 2.16). Specifically, as alternatives to investments in US government bonds (US_Gov) we consider inflation-indexed bonds (US_IL), MBS (US_MBS), USD-denominated bonds issued by supranational institutions (US_qGov), corporate bonds (US_Corp) and equities (EQ_Corp).
Assuming that government bonds should in any case remain the main component of central bank reserves with a portfolio share of at least 80%, we introduce the following constraints on the other asset classes.
-
-
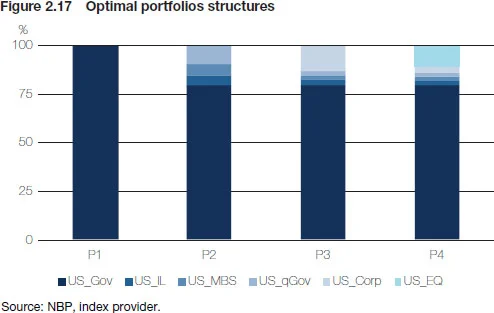
P1 – reference portfolio – 100% US_Govt
-
-
-
P2 – US_Gov ≥ 80%, excluding US_Corp and US_EQ
-
-
-
P3 – US_Gov ≥ 80%, excluding US_EQ
-
-
-
P4 – US_Govt ≥ 80%
-
Portfolio optimisation for the variants excluding investments in corporate bond and equity markets (P2) suggests diversifying Treasuries with inflation-indexed bonds, MBS and supranationals. Once corporate bonds are added to the mix (P3), their optimal allocation is estimated at 13%. However, full spectrum optimisation (P4) suggests investing almost 11% in equities, with a much more modest contribution from corporate bonds. The weight of government bonds in all portfolios reaches the lower bound of 80%, limiting the extent of further diversification into alternative asset classes (see Figure 2.17 and Table 2.4).
Callability refers to the fact that some corporate bonds are issued with a provision that allows the issuer to redeem (call) the bond at a fixed price prior to contractual maturity, exposing bond holders to reinvestment risk. Naturally, much like with fixed rate mortgages, call provisions are most likely to be exercised in an environment of declining yields since borrowers can then refinance their high coupon debt at lower interest rates. Yet, this embedded short option position leaves credit investors with a skewed, or asymmetric, payout profile: if rates rise, they stand to suffer capital depreciation through mark-to-market losses; if rates fall, their bonds are likely to be called, forcing them to reinvest capital less favourably (this effect is often called “negative convexity”). In addition, since rates typically fall in macroeconomic downturns, callability works against bondholders exactly at a time when credit spreads widen and credit risk increases, exerting additional pressure on corporate bond portfolios. Hence, it seems that when it rains, it pours for corporate bond investors.
Clearly, not all corporate bonds have call provisions (roughly 50% in our benchmark index), and some research suggests that call provisions are not exercised optimally. Still, the fact remains that, at least in principle, the historically observed excess return (Figure 2.14) does not come free.
To assess the risk/return profile of corporate bonds somewhat more formally, we have performed a simple optimisation exercise in which we start from a US Treasuries-only portfolio and gradually allow exposures in alternatives: mortgage-backed securities (MBS), inflation linkers, as well as equities and corporate bonds (see Box 2.5). The interesting result is that when exposure to corporate bonds is allowed, the mean variance optimiser puts their weight at 13%. However, when we add equities to the mix, the weight of corporate credit in the portfolio falls to a mere 3% with equities at more than three times that. Indeed, there is almost no meaningful improvement in the Sharpe ratio for Portfolios 2 and 3 – compared to the benchmark UST Portfolio 1 – until an exposure to equities is added.
| P1 | P2 | P3 | P4 | |
| Average return | 6% | 7% | 7% | 8% |
| Volatility | 15% | 15% | 15% | 15% |
| Probability of a negative rate of return | 37% | 36% | 35% | 32% |
| Sharpe ratio | 0.42 | 0.44 | 0.45 | 0.53 |
| Source: NBP, index provider. | ||||
With all the usual caveats, this analysis seems to suggest that there probably is a limit to how large a corporate bond portfolio one should want to hold, and this limit may be lower than we would like to think. To put it in even more radical terms, while it is difficult to generalise, those who consider the excess return reported above not enough to compensate for all the fuss related with taking on exposure to corporate credit might be better served by investing in equities instead.
Conclusion
As for the NBP, our position – having learned all the lessons discussed here – is that we can live with the lower-than-advertised excess return, although it makes us cautious not to overstate the benefits of corporate credit. Including some allocation to corporate bonds in the SAA portfolio probably serves to diversify and – at least on the margin – also improve FX reserves returns. Especially given that the corporate bond market seems to be “efficiently inefficient” enough to justify and incentivise active portfolio management, not least through interest rate and spread duration positions. Another, perhaps more down to earth, point relates to the learning process – for both the middle and front office – kick-started by the corporate credit odyssey. Looking back, the work on the benchmark has forced us to develop new skills in both active investment and risk management domains. As a result, we have grown and become more sophisticated and knowledgeable as an institution and team of people from various areas within the bank. Still, as far as purely investment prospects are concerned, the long-term advantages of corporate credit should perhaps not be overstated.
The views expressed are those of the authors and do not necessarily reflect the official NBP position. We would like to thank colleagues from the Financial Risk Management Department and External Operations Department for many helpful discussion and fruitful collaboration on the project, including Ewa Szafarczyk and Paweł Fronczak. Thanks also go to Łukasz Gąsior and Michał Markun for providing excellent assistance with quantitative analyses included herein.
Only users who have a paid subscription or are part of a corporate subscription are able to print or copy content.
To access these options, along with all other subscription benefits, please contact info@centralbanking.com or view our subscription options here: subscriptions.centralbanking.com/subscribe
You are currently unable to print this content. Please contact info@centralbanking.com to find out more.
You are currently unable to copy this content. Please contact info@centralbanking.com to find out more.
Copyright Infopro Digital Limited. All rights reserved.
As outlined in our terms and conditions, https://www.infopro-digital.com/terms-and-conditions/subscriptions/ (point 2.4), printing is limited to a single copy.
If you would like to purchase additional rights please email info@centralbanking.com test test test
Copyright Infopro Digital Limited. All rights reserved.
You may share this content using our article tools. As outlined in our terms and conditions, https://www.infopro-digital.com/terms-and-conditions/subscriptions/ (clause 2.4), an Authorised User may only make one copy of the materials for their own personal use. You must also comply with the restrictions in clause 2.5.
If you would like to purchase additional rights please email info@centralbanking.com test test test


