Developing an integrated information system for reserve management: the experience of Peru
Jesus Alberto Zapata, Guillermo Alarcon and Omar Santivañez
Developing an integrated information system for reserve management: the experience of Peru
Executive summary
Trends in reserve management: 2020 survey results
Interview: Ma. Ramona Santiago
Scoring climate risks: which countries are the most resilient?
A hundred ways to skin a cat – or some practical thoughts on benchmark replication
Developing a sovereign ALM framework: a case study of Mauritius
Developing an integrated information system for reserve management: the experience of Peru
Appendix 1: Survey questionnaire
Appendix 2: Survey responses and comments
Appendix 3: Reserve statistics
The Central Reserve Bank of Peru (CRBP) holds over $74 billion in international reserves. This level represents an increase of 785% on that of 20 years ago and growth of 124% over the past decade. Moreover, the ratio of reserves to GDP has risen from 2% in 1990 to around 32%, as of April 2020 (see Figure 6.1).

The significant increase in reserves led to a surge in the number and size of transactions. The rise also demanded higher returns within the risk tolerance allowed for a traditional central bank in an increasingly complex and sophisticated financial market. This led – in the main – to look for more options in the scope for investing in new asset classes, which, in turn, allowed greater diversification and better performance. This growth of reserves therefore posed a towering challenge in terms of their administration, forcing CRBP officials to rethink the investment objectives as well as their guidelines. An efficient management of international reserves under these new conditions required more personnel and systems adapted to decision-making at all the levels of the institution.
The objective of this chapter is to describe the process we followed to build an integrated system that was to be used as a key tool in the management of international reserves. First, we set out in detail the problem we had with the systems we used to carry out our work, then we explain the alternative solution we arrived at after the respective analysis, and the implementation of the project. Subsequently, we describe the product obtained as well as the benefits we achieved. In the conclusions we mention some points that we believe were important for the success of the project, as well as the possibility that the scope of the solution could be expanded by similar projects to other areas and functions of the central bank. It is our hope that this chapter will make a contribution in the always challenging role of managing international reserves.
Problems, conceptual requirements and IT architecture
At the beginning of 2011, the International Operations Department (IOD), which is in charge of managing reserves at the CRBP, had three systems that were used directly in the investment process and 12 support systems. These systems operated independently, with data transfer between them carried out either manually or semi-automatically.
Having to work with these different non-integrated systems forced staff to produce reports in spreadsheets, extracting information from various sources of heterogeneous technologies and disorganised data. This implied high operational risk and also required specific knowledge of each one of the systems to extract the information needed. In addition, preparing customised reports or building time series took considerable time due to the fact that the various applications that had been developed led to the creation of “information islands” that were difficult to maintain and integrate over time. Obviously, the problem evolved becoming more complicated to handle.
In the end, we wanted to proceed with an “integrated central repository” which would include all the raw, meaningful and useful data obtained from heterogeneous sources, and which we could then organise for use in a data-driven decision-making process at strategic, tactical and operational levels through user-friendly reporting, dashboards and data analytics.
Datamart (DM) and business intelligence (BI)
The first step was to carry out research on existing IT architectures, involving “data integration”, “storage” and “data visualisation/analysis”. To this end, we explored options from “classical transactional databases”11 “Classical transactional databases”, known as OLTP (online transaction processing), are used more often to process day-to-day transactions, designed and optimised to read, write and update data. and analytical multidimensional “datamart solutions with OLAP”22 “Datamart solutions with OLAP (online analytical processing)” are built to store large quantities of historical data from multiple sources, and designed and optimised for reporting and analysis, solving complex querying across all the data. to “big data”33 “Big data”, compared to transactional databases and datamarts, deals with unstructured data (eg, photo, videos, text, social media content). This technology did not fit our requirements at that time, which prioritised multidimensional analysis of the first kind of data. architectures. We found that DM and BI were the most appropriate, efficient and specialised architectures for working with the kind of data we had in our systems and for performing multidimensional analysis of structured data.44 “Structured data” is contained in rows and columns with fixed predefined fields such as data in a spreadsheet.

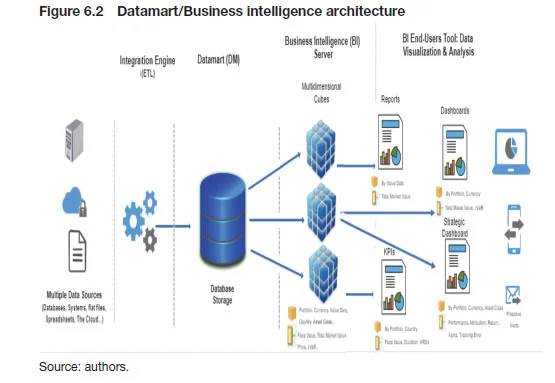
By its nature, this comprehensive DM/BI solution has three main components: (i) data integration; (ii) storage; and (iii) data visualisation/analysis. The first element extracts, transforms and loads (ETL) structured data, combining them from multiple internal (databases, flat files, spreadsheets, etc) and external (the cloud, APIs, etc) sources. The second component allows the storing of data with database multidimensional modelling that can be “queried” by end-users accessing it through specialised BI tools. The last module refers to the enterprise BI solution, which allows end-users access to the data for analysis and visualisation, and to build their own reports and interactive dashboards without prior knowledge of any programming language (see Figure 6.2).
The project
Given this context, in 2011 the IOD submitted for approval a project for building a database and implementing a business intelligence system that would result in a better analytical and decision-making process for the management of international reserves.
The project was approved by senior management of the central bank after showing them that a centralised system to manage data will allow us to significantly improve the timeliness with which we provide adequately organised information for the decision-making process. We presented a highly detailed study of the project’s requirements, which included the variables and their dimensions, identifying the sources of information, as well as the theoretical, mathematical or statistical definitions of the most complex variables. The initial budget considered for the project was around $310,000 (PEN799,000) (including datamart and BI platform, software licenses and implementation).
Due to the size of the project, it was decided to divide its implementation into three stages, the first taking 13 months, the second and the third 10 months each. Subsequent enhancements have been made to the data-loading system and new sources, variables and reports have also been included.
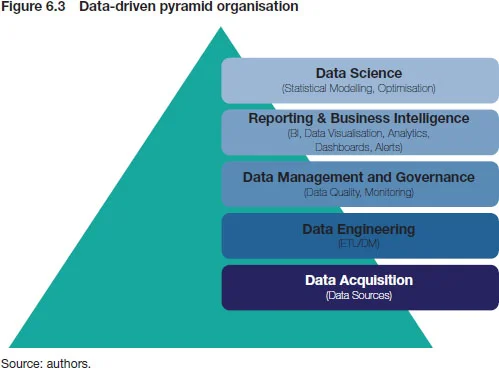
From the very beginning there was an awareness that, to become a data-driven organisation, it was necessary to build a solid foundation that automated the tasks of data acquisition and storage with an appropriate framework for the management and governance of data, which ultimately serves for visualisation and analysis, either from a descriptive point of view or for predictive purposes through the automatic resolution of statistical and optimisation models. Thus, the project is framed around the idea that the IOD would make decisions based on data that are transformed into increasingly elaborated information, as shown in Figure 6.3.
An important issue here is that the project was not restricted to information management and preparing reports for senior management decision-making, but also included the creation of useful reports for operational areas and the middle levels of decision-making, given the fact that the technology allows us to access these resources. As a public institution, the first step was to go through public procurement processes to acquire the hardware, software and the services of an advisor. A multidisciplinary team integrated with CRBP staff was organised for the project, which attempted to cover the various aspects of this strategy.

In the first stage, the three main components of the architecture were completely implemented from scratch, moving from data integration and storage to the visualisation of information in reports and dashboards. This meant that, 13 months from its first implementation, all the functionalities developed could be used by end-users through internet and mobile interfaces. This successful result was the base for receiving senior management approval for the subsequent stages.
For data integration, we employ specialised software that, depending on the type of source, utilises different kinds of components in its workflows, including batch processes, web services in Python, structured query language (SQL) queries and the reading of flat and spreadsheet files. Every task is performed fulfilling all relevant security measures.
For storage, the first destination of the data points is the “staging area”, where the data is kept almost identically to how it is found in the source. Then the data is transferred to a final area (ie, DM) where there is a multidimensional modelling system that combines different sources of information that can be used in reports and dashboards by the end-user in a flexible way – from the cubes of thematic information developed without the intervention of the IT area.
For data visualisation/analysis, we used a specialised two-component BI software suite. The first component is a BI server and administration tool for creating multidimensional cubes, processing end-user requests and retrieving all data as efficiently as possible. The second is a BI end-user interface tool that permits, through multidimensional cubes, either visualising pre-built reports and dashboards or querying information and building their own reports via tables and interactive graphs. Furthermore, it is crucial to realise that this BI layer serves not only for analysis but also analytics, implying solving statistical and optimisation models that have been developed by internal areas of the IOD.
We developed the multidimensional cubes, in which data is received directly from the source database, organising the information according to the requirements of the different areas of the IOD. Cubes are data structures that allow end-user querying of useful information (measures) for analysis purposes through dimensions (eg, portfolio tranches, asset class, currency). A cube’s structure is defined by dimensions that end-users use to slice and dice, while measures (eg, market value, price, conditional value-at-risk (cVaR), tracking error) are actually metrics of interest, aggregated or in detail, as if they were contained in cells within the cube.
Verifying the data load is complex. The process involves a series of daily activities to monitor not only each of the data sources but also the status of the ETL processes. This is achieved through the construction of crosscheck reports, which (in addition to other controls) allow us to see that the data have been correctly uploaded to the DM and become accessible from the BI solution. The quality of the information is central to the working of the system. Therefore, before implementation, we carried out a historical exploratory analysis of all the variables of the data sources to exclude the ones that had null or inconsistent values, or were of low quality.
Likewise, before beginning the production of new reports there is a detailed validation process in which end-users participate. For this, we verify that the data obtained manually by end-users is consistent with that obtained through the reports built in the BI solution in a determined time horizon and by choosing some cases for validation. After this stage, we established daily controls to guarantee the quality of the data in these new reports.
Based on this, and the fact that data and the information that can be obtained are considered assets of great value to decision-making, we decided to implement an applied data management approach. This means that we can seek to identify and provide the information needed by the different areas while ensuring its timely availability, assurance, confidentiality and generation of value, and that it is comprehensively managed.
The product
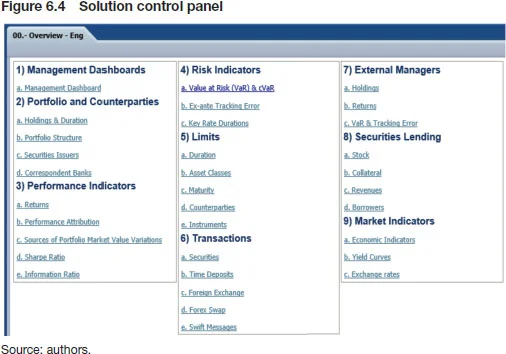
After implementation of the three stages of the project and subsequent enhancements, over the years we have been able to develop a complete datamart and business intelligence system, with the following five main characteristics (see Figure 6.4, overleaf).
-
A complete set of reports for making operational/tactical/strategic decisions related to the investment process of international reserves, and other related matters, with information as of 1 January 2008. The main type of reports constructed are:
-
information of holdings in the entire portfolio by tranches, asset class, instruments and currencies (the data can be daily, monthly or annual); ■ detailed information on the portfolio assets, specified by purchase date, maturity date, counterparty, currency, price, international identification number, duration, etc;
-
information by counterparty (issuers of securities) and banks under various dimensions;
-
information about performance, portfolio and benchmark return with the detail of asset class, as well as performance attribution by risk factors, Sharpe and information ratios, etc;
-
information on risk, portfolio value-at-risk (VaR), cVaR, tracking error, key rate durations, etc;
-
information used to verify investment guidelines, maximum deviations in asset classes, instruments and counterparties, etc;
-
information on transactions, available within some hours on the same day of operation after the release of an electronic confirmation message.
-
-
Dashboards (including geo-visualisation for senior management) and reports in internet and mobile apps for internal and external managers monitoring: graphs and tables with historical data have been developed to allow deeper analysis. Having dashboards allows us to provide the different hierarchical staff levels at the central bank, including senior management, with a comprehensive snapshot of the main performance and risk measures variables. See Figure 6.4 below.
-
On-demand reports to attend specific requirements: Since the information is centralised, specific queries (external requests, audit requirements, etc) can be answered in a timely and reliable manner.
-
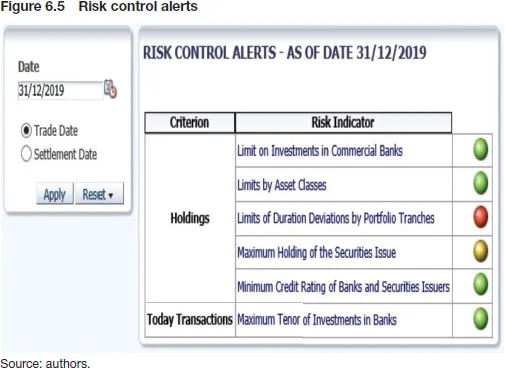
Alerts – or rather the possibility of defining alerts and notifications for different performance and risk related variables: Having an alert system allows for a faster response and efficient risk management. These reports provide the potential to use past information to identify trends that may be helpful in future decision-making. See Figure 6.5 below.
-
Business analytics capabilities, adding business analytics (BA) to the BI: BI capabilities have been extended using the R programming language for the resolution of internally developed BA models. For some years, the IOD has developed a series of models built in MatLab, like “yield curve” construction. Their equivalent R models are currently integrated with the BI solution since it has native server capabilities for the resolution of models in this specific language.

The construction process followed all the principles of data governance (including business process management and operational risk management). At present, the system enters information on approximately 6,500 variables coming from 945,000 daily records from around 15 different sources through a series of ETL processes. Data sources are different in nature, including databases in Oracle and DB2, flat and spreadsheet files, data in the Cloud, etc.
It is important to mention that, as of April 2020, we are still in the process of completing our database with new sources of information originated due to the dynamic nature of the investment process.

Even though, at present we consider this product meets ourcurrent requirements, we are open to explore future developments in other technologies like big data around our DM/BI Solution, either for data ingestion and storage of semi-structured55 “Semi-structured data” generally comes in open standard file formats as JSON or XML. This kind of data is available through the internet from several sources, such as supranational organisations or other central banks, and corresponds to detailed information about economic and financial indicators. or unstructured data (eg, photo, videos, social media content, etc), or for machine learning processes which require fast processing of large data volumes.
Benefits of the new system
The creation of a centralised DM and BI system oriented to the multidimensional query of historical information has provided considerable capacity to dispose of and exploit the information available in a centralised repository on a timely manner, as well as to easily build (simple and visual) reports and dashboards. Furthermore, we have gained accessibility to all this information (combined and consolidated to the highest level of detail) through the internet and mobile environments.
The most important benefit is probably that access to all this information means we can make better decisions based on objective indicators (updated and with a deep level of detail) while identifying opportunities and risks for the management of the international reserves. Additionally, following crucial aspects of IT security, we have been able to mitigate the operational risk of managing information with the automation of data collection, the loading of variables, the aggregation and access to different variables and in the generation of reports. The implementation process has allowed us to rethink and improve procedures, methodologies and calculations, and to reach a seamlessly integration with BA.
Conclusions
With the development and implementation of the datamart and business intelligence system we have the advantage of working a centralised database with mixed information from around 15 information sources and approximately 6,500 variables since January 2008.
The availability of this information has given us the possibility to perform multidimensional exploitation of the information stored in the datamart for operational/tactical/strategic decision making to efficiently manage international reserves independent of traditional IT services.
Based on our experience, the key success factors for the project were:
-
-
strong senior management support;
-
-
-
user area and IT commitment for every crucial project phase (since it required a team with multidisciplinary knowledge: portfolio and risk management, financial markets and instruments, database programming, networking, etc);
-
-
-
realistic scope delimitation for each phase of the project (sources, variables and reports/dashboards);
-
-
-
daily activities that strictly respect the task to be carried out (data management, data governance and operational risk management).
-
Finally, an important conclusion reached is that our solution could be applicable to the administration of any type of information. For this reason, after observing the successful results obtained with the IOD’s DM, similar projects have been replicated in other areas of the central bank, which currently enjoy the benefits of these developments.
The views expressed by the authors do not necessarily reflect the position of the Central Reserve Bank of Peru.
Only users who have a paid subscription or are part of a corporate subscription are able to print or copy content.
To access these options, along with all other subscription benefits, please contact info@centralbanking.com or view our subscription options here: http://subscriptions.centralbanking.com/subscribe
You are currently unable to print this content. Please contact info@centralbanking.com to find out more.
You are currently unable to copy this content. Please contact info@centralbanking.com to find out more.
Copyright Infopro Digital Limited. All rights reserved.
As outlined in our terms and conditions, https://www.infopro-digital.com/terms-and-conditions/subscriptions/ (point 2.4), printing is limited to a single copy.
If you would like to purchase additional rights please email info@centralbanking.com
Copyright Infopro Digital Limited. All rights reserved.
You may share this content using our article tools. As outlined in our terms and conditions, https://www.infopro-digital.com/terms-and-conditions/subscriptions/ (clause 2.4), an Authorised User may only make one copy of the materials for their own personal use. You must also comply with the restrictions in clause 2.5.
If you would like to purchase additional rights please email info@centralbanking.com


