Appendix 3: Reserve statistics
Appendix 3: Reserve statistics
Foreword
The cashless society?
Executive summary
Trends in reserve management: 2019 survey results
Implementing a corporate bond portfolio: lessons learned at the NBP
Sovereigns and ESG: Is there value in virtue?
A methodology to measure and monitor liquidity risk in foreign reserves portfolios
Reserve management: A governor’s eye view
How Singapore manages its reserves
Appendix 1: Survey questionnaire
Appendix 2: Survey responses and comments
Appendix 3: Reserve statistics
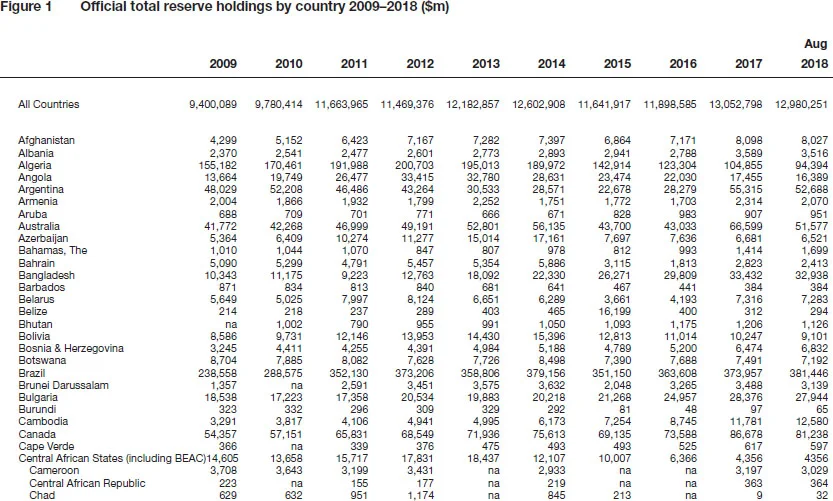
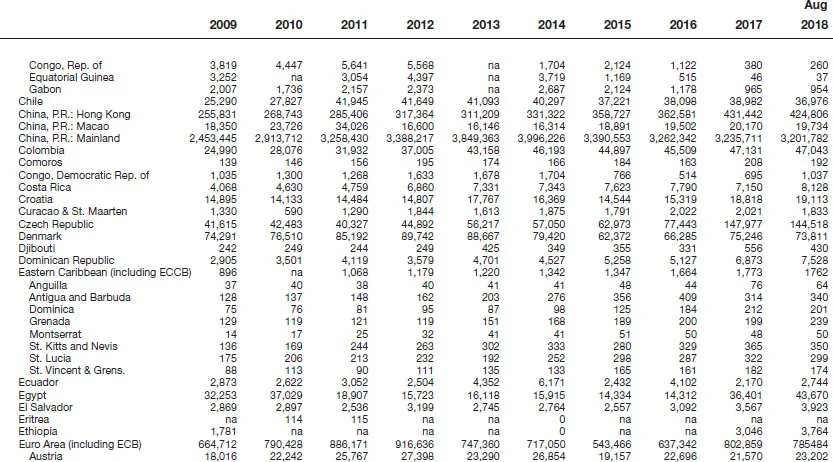
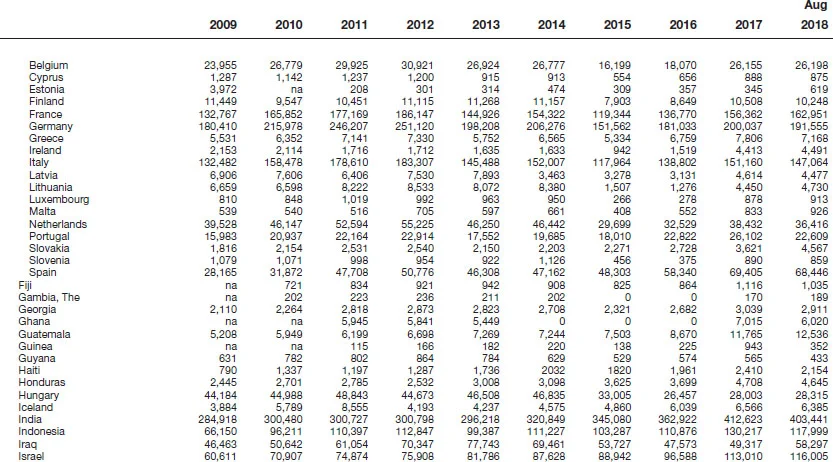
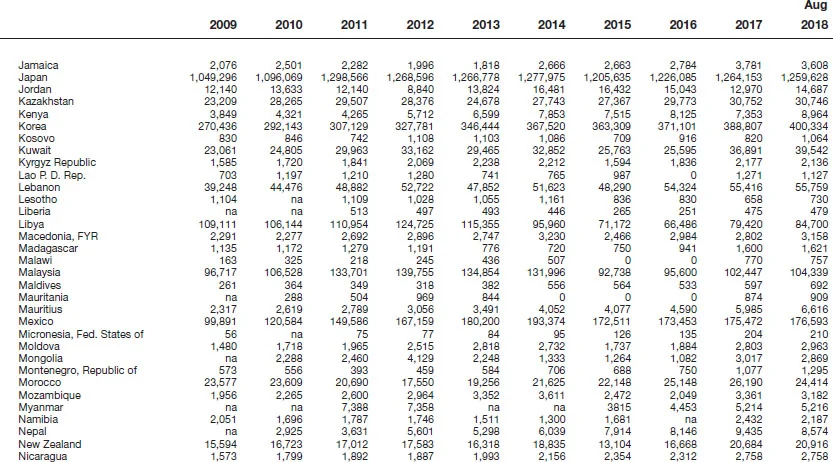
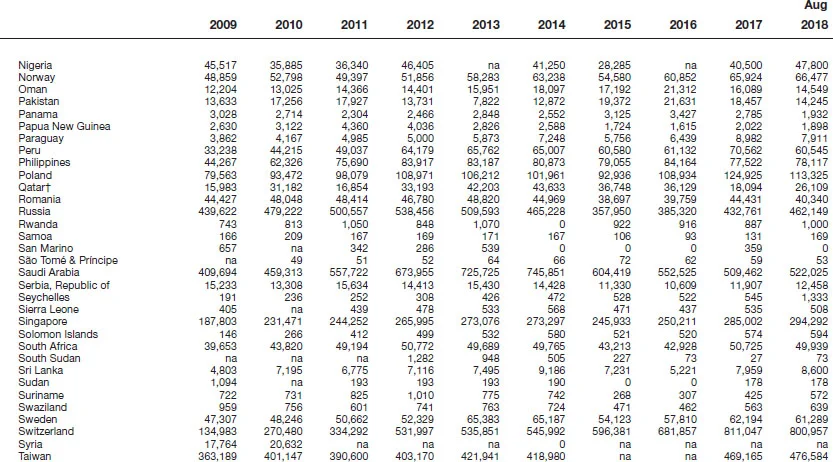
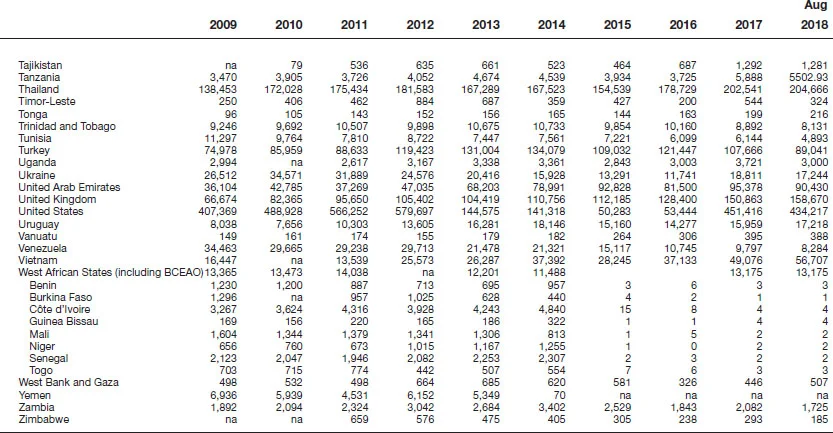
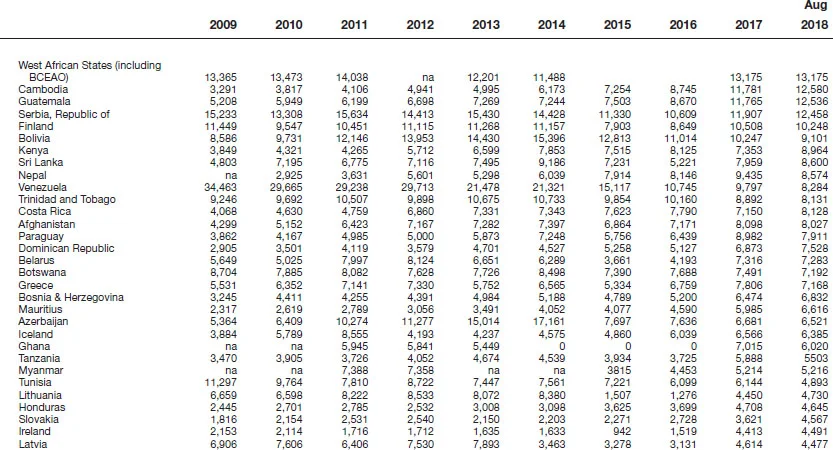
| Figure 1 | Official total reserves* holdings, by country 2009–2018 |
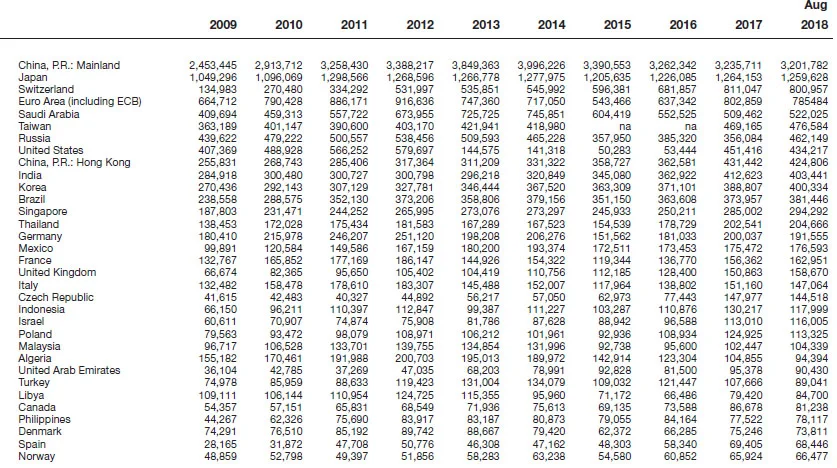
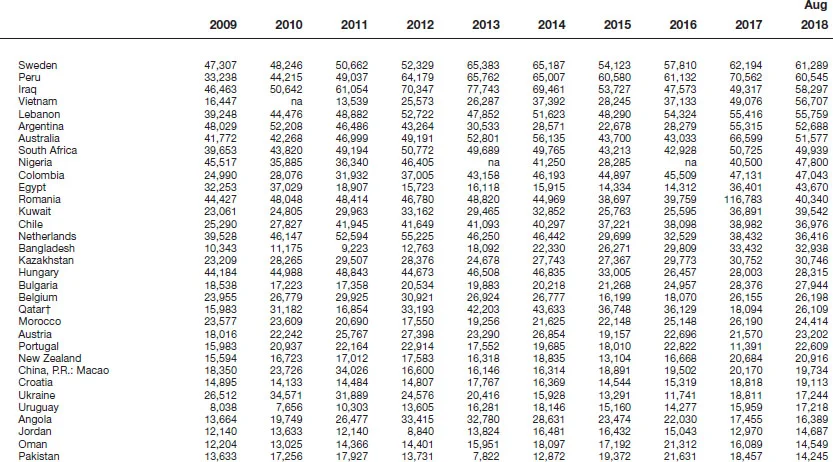
| Figure 2 | Top 100 official total reserves* holdings, by value 2009–2018 |
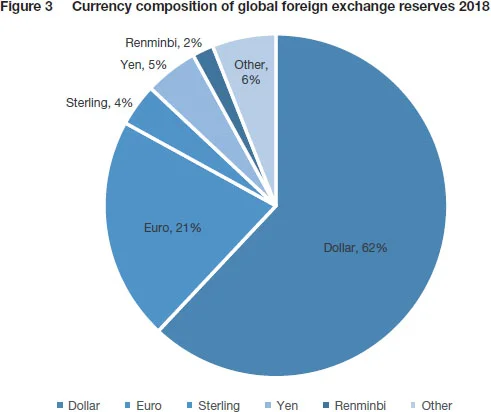
| Figure 3 | Currency composition of foreign exchange reserves 2018* |
*Figures for “total reserves” refer to foreign exchange, gold – at market prices – SDRs, and positions at the International Monetary Fund (IMF), unless otherwise stated. This calculation differs from those produced by the Fund, which value gold at historical prices. Figures for “foreign exchange reserves” refer to holdings of currencies only. Years refer to year-end except 2018, which is a figure for August 2018 or nearest available to that. Currency data are from Q4 2018. Sources: IMF International Financial Statistics, COFER database, annual reports and individual central bank websites.

Only users who have a paid subscription or are part of a corporate subscription are able to print or copy content.
To access these options, along with all other subscription benefits, please contact info@centralbanking.com or view our subscription options here: http://subscriptions.centralbanking.com/subscribe
You are currently unable to print this content. Please contact info@centralbanking.com to find out more.
You are currently unable to copy this content. Please contact info@centralbanking.com to find out more.
Copyright Infopro Digital Limited. All rights reserved.
As outlined in our terms and conditions, https://www.infopro-digital.com/terms-and-conditions/subscriptions/ (point 2.4), printing is limited to a single copy.
If you would like to purchase additional rights please email info@centralbanking.com
Copyright Infopro Digital Limited. All rights reserved.
You may share this content using our article tools. As outlined in our terms and conditions, https://www.infopro-digital.com/terms-and-conditions/subscriptions/ (clause 2.4), an Authorised User may only make one copy of the materials for their own personal use. You must also comply with the restrictions in clause 2.5.
If you would like to purchase additional rights please email info@centralbanking.com


