Sovereigns and ESG: Is there value in virtue?
Michael Ridley and Peter Barnshaw
Foreword
The cashless society?
Executive summary
Trends in reserve management: 2019 survey results
Implementing a corporate bond portfolio: lessons learned at the NBP
Sovereigns and ESG: Is there value in virtue?
A methodology to measure and monitor liquidity risk in foreign reserves portfolios
Reserve management: A governor’s eye view
How Singapore manages its reserves
Appendix 1: Survey questionnaire
Appendix 2: Survey responses and comments
Appendix 3: Reserve statistics
Over the past few years, an increasing number of fixed income analysts have sought to use an environmental, social and governance (ESG) approach to analyse corporate credit. This development has perhaps been prompted by concerns for global stewardship, the hope of achieving better long-term returns, or the growth of a green, social and sustainability bond supply.
ESG analysis has its roots in both ethical and sustainable investing, whereby investors are concerned not just with immediate financial return but also the impact of the production process and product on society at large, as well as the environment, both locally and globally. However, there is also a hope that ESG can achieve superior returns, by asking informed questions or only pursuing investment in firms with robust and sustainable plans.
Using ESG analysis may allow longer-term, more balanced and comprehensive valuations. It could uncover latent risks and identify issuers with negative or positive momentum. Essentially, ESG can be a useful analytical tool as it probes and questions how an entity’s environmental, social and governance conditions impacts the entity, and how these factors have an effect on its ability to meet principal and interest payments on its borrowings. ESG factors are distinct but related sets of issues and risks, and using ESG analysis allows one to delve deeper and develop a more rounded perspective than in a traditional analysis framework.
Recently, the HSBC fixed income research team has extended their ESG analysis to cover sovereigns. How to implement this simple yet powerful tool is shown below, with countries being assigned their own ESG score. This score appears to explain a large proportion of the variability of sovereign credit default swaps (CDS) and also has predictive power.
Although the topic of ESG from an investor perspective is beyond the scope of this chapter, it has of course been covered from a number of angles elsewhere. However, given the focus of this book, it is worth mentioning the increasing interest among reserve managers and sovereign investors more broadly, as noted in surveys in the HSBC Reserve Management Trends series. This development shows no signs of abating, and it is hoped this chapter will be of practical value to reserve managers as they endeavour to include ESG in their frameworks.
Sovereign ESG scores
A model to score 77 countries according to their main ESG attributes was developed. This model focuses on the whole ESG spectrum, not just on environmental vulnerabilities. More weight was given to governance and social issues than to environmental, because these areas are viewed as more immediately relevant. Five inputs were used to create these scores: two measuring governance, two scoring social and one measuring environmental, each with equal weightings. While only five different factors were used, this includes a total of 43 different individual metrics. The overall scores range from 0 to 10, with 0 being a “low” ESG score and 10 a “high” score. The model is explained in more detail in Box 3.1.
The sovereign ESG scores are a helpful way to assess long-term value in sovereign credit. The main findings are cited below, before they are explained in more detail.
-
-
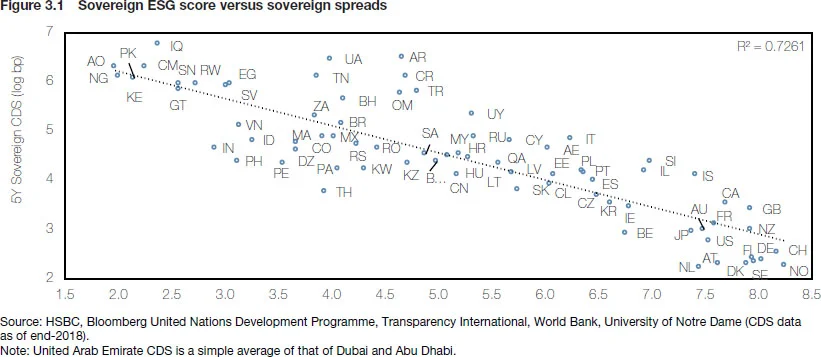
A strong correlation was found between the sovereign ESG scores and their CDS spreads (Figure 3.1)
-
-
-
Sovereign CDS spreads are now more correlated with, and sensitive to, our ESG measures than in 2010
-
-
-
Those sovereigns that saw an ESG improvement between 2010 and 2018 also mostly experienced spread tightening
-
-
-
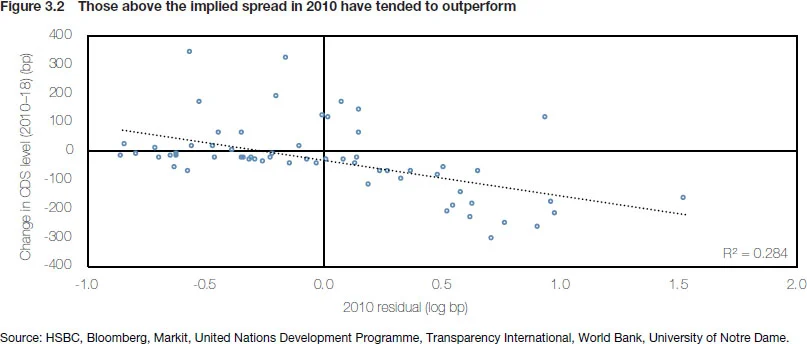
Sovereigns that had spreads flagged as the cheapest by our ESG metric in 2010 saw the most tightening between 2010 and today, implying good predictive power (see Figure 3.2). This points to potential outperformance for those currently identified as cheap
-
-
-
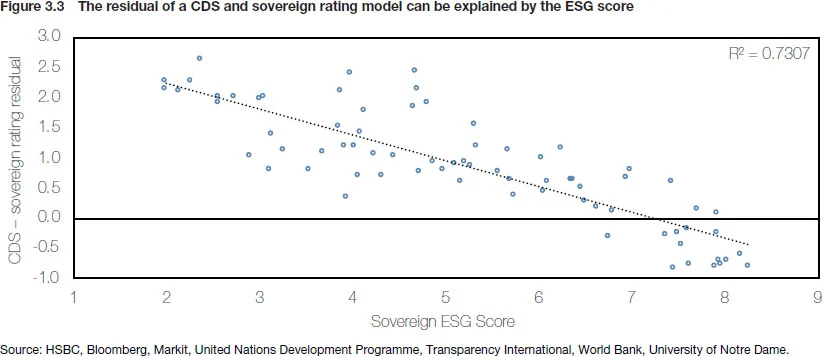
The unexplained component (residual) of CDS spreads from credit ratings is largely captured by the sovereign ESG score (Figure 3.3)
-
-
-
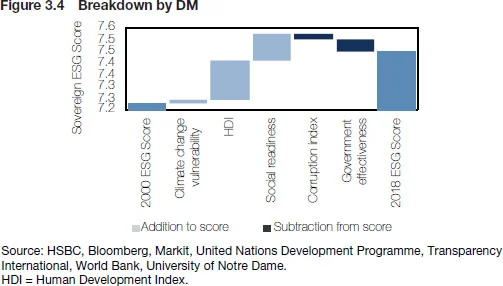
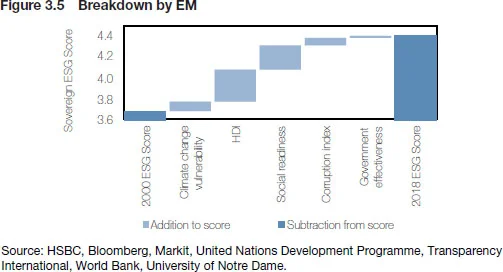
Governance factors are a bigger driver of ESG scores today (and hence CDS spreads) than social and environmental, although social scores have improved by more than governance and environmental since 2000 (see Figures 3.4 and 3.5)
-
-
-
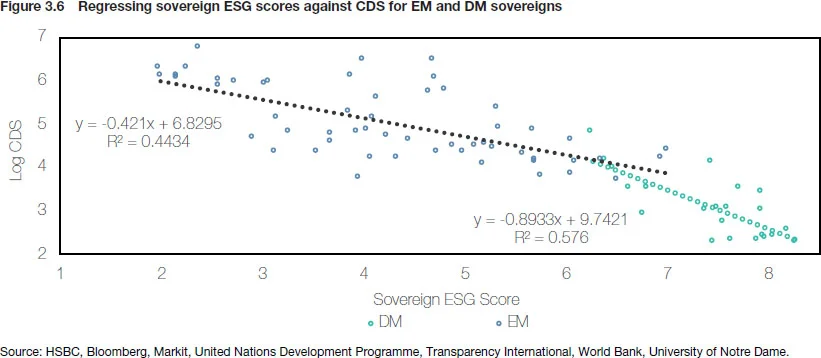
ESG scores seem to drive CDS valuations more for developing market sovereigns than for emerging markets (EM) (see Figure 3.6)
-
Sovereign ESG score has high explanatory power
To investigate the link between the sovereign ESG score and CDS spreads, a regression between the two factors was run to attempt to explain the variation in CDS spreads using the ESG score. 77 countries were charted by ESG score against the natural logarithm of their five-year CDS. A strong relationship was shown, with an R2 of 72.6%. Sovereigns above the regression line were identified as “cheap”, while those below the line appear as “rich”.11 It can be noted that there are a number of sovereigns that appear cheap or attractive in Figure 3.1, given that they lie significantly above the regression line. However, caution is urged regarding this interpretation. One factor to bear in mind is that the ESG date is updated only annually, while CDS data is updated daily. Also, the ESG data used for such countries is not representative of the current situation, and up-to-date ESG data for these countries might allow a better fit with these countries’ current CDS spreads. In addition, bear in mind that risk aversion and domestic factors can also distort CDS valuations in the short term.
Residual forecasting power
A large residual from the 2010 regression model implies that, based on the country’s ESG score, the sovereign CDS spread should be tighter. To verify this, the sovereign ESG score back in 2010 was recreated, and a regression of this score was examined against CDS spreads. This residual and the spread performance for the period 2010–18 is shown in Figure 3.2. The findings confirm the assumption that large positive residual countries outperform, and spreads tighten more aggressively than for countries that appear rich to the regression. Egypt, Tunisia, Brazil and South Africa were among those flagged as tight and have since widened, while Angola, Latvia and Pakistan were flagged as cheap and are now a lot tighter than in 2010. This suggests that, going forward, one could expect spread tightening from those countries with a large residual as of end-2018.
Note also that out of the 18 countries with residuals over +0.25 in 2010, 17 saw tightening and only one experienced widening
Credit ratings and ESG
Due to the overlap between the ESG scores and credit ratings, the relationship between the two was also analysed. Unsurprisingly, there was a strong link found between the sovereign ESG score and the average of the three credit ratings for each country. There is also a high correlation between CDS spreads and credit ratings. What is surprising, however, is that the ESG scores were able to explain a large portion of the CDS spread that is not explained by credit ratings.
To examine this, the residual from the CDS spread and sovereign ratings regression were looked at, and these residuals were regressed against the sovereign ESG score. A large proportion of the residual can indeed be explained by the sovereign ESG score – the R2 in Figure 3.3 is 73% – therefore, the ESG factors can play an important role in analysing value for sovereign CDS spreads, on top of that already explained by credit rating agencies.
Given the clear link between the sovereign ESG scores and CDS spreads, the next area to investigate was the drivers of the change in ESG and how they compare between EM and DM markets. The drivers of spreads in EM versus DM markets were also examined, as well how much of a role ESG plays in this.
How ESG scores have progressed
In aggregate, ESG scores increased from 2000 to 2018, with increases seen for all the five different factors. In the DM space, Portugal and South Korea experienced the largest improvement in their overall score, while for EMs it was China and Latvia. Figures 3.4 and 3.5 show what is driving the change in ESG scores for DM sovereigns and EM sovereigns, with both the average DM and EM ESG scores increasing over the period in question. However, and interestingly for DM countries, on average the environmental and social scores improved, while governance scores deteriorated. By contrast, for EM states the environmental, social and governance scores all improved.
How ESG impacts DM versus EM
Perhaps surprisingly, it was found that DM countries are more impacted by ESG factors than DM countries (see Figure 3.6). This is shown by two different measures. First, the slope of the regression line is much steeper for DM than it is for EM. DM countries’ Also, CDS prices are more impacted by ESG issues than EM countries’ CDS prices – a change in a DM country’s ESG score has a larger impact on its modelled CDS spread than a change in an EM country’s ESG score. In addition, the R2 is higher for the DM line of best fit, meaning the variation in ESG can explain more of the variation in DM CDS spreads than EM.
This seems counterintuitive, perhaps because, for EM states, factors other than ESG have a larger impact on their CDS. It may also be that factors such as indebtedness and economic performance have a bigger impact on where EM countries trade than for DM states.
Interestingly, if peripheral or southern European states such as Portugal, Greece or Italy were reclassified as EM states rather than DM, this would serve to flatten the DM curve, putting it more in alignment with the current EM curve. The southern European states have CDS that trade quite wide of where one would expect given their ESG scores – probably because they have “other factors”, including high leverage, that drive their CDS performance.
Environmental damage versus transition risk
While the model considers environmental damage, it does not take into account transition risk – the risk that the world takes climate change seriously – as a result of which countries that export fossil fuels (and companies that produce fossil fuel) face diminishing demand for their products. While transition risk is excluded from the model, it is possible to measure a country’s vulnerability by looking at its dependence on oil and how this has changed in recent times. For example, Algeria has seen a reduction in its oil dependence, while both Oman and Bahrain have a high dependency that has been increasing over the last 15 years.
Box 3.1 The model: Five components
Here the five different factors are introduced, as well as the reasons for their inclusion in the score.
Environmental
Measure 1: Climate change resilience
This measure uses data from the University of Notre Dame Global Adaptation Index to examine the vulnerability of different countries by looking at six different sectors, and within these the exposure to climate-related hazards, the sensitivity to the impacts of these hazards and also the adaptive capacity to cope with the impacts.
It aims to measure both those sovereigns exposed to climate change and those that are least prepared and able to adapt in a changing environment. Vulnerability has higher correlation than exposure due to different adaptive capacities, and the read-through into fiscal prudence and therefore sovereign CDS spreads.
Social
Measure 2: The Human Development Index
This index, compiled by the United Nations Development Programme, looks at the development of a country, combining data on: (i) a long healthy life; (ii) being knowledgeable; and (iii) having a good standard of living. A combination of these measures provides an aggregate score. In our dataset, Norway has the highest HDI score, with Senegal the lowest.
This is a broad measure of development that is important from a social point of view, and which can have implications for a government’s ability to meet its obligations.
Measure 3: Social readiness
Provided by the University of Notre Dame, this measure includes both IT infrastructure and innovation, the former considering the use of mobile phones, broadband and individuals’ use of the Internet, while the latter is captured using patents filed per capita.
This is another measure of economic development, one that looks at the technology element in particular, something that is likely to become increasingly important.
Governance
Measure 4: Corruption perception
The Corruption Perception Index, created by the non-governmental organisation (NGO) Transparency International, aims to score countries based on the perceived corruption of their public sector according to experts and business executives. In total, this measure incorporates 13 different surveys related to such issues.
This can be considered a good measure of governance since a high level of corruption will reduce a government’s willingness to meet its financial obligations, and therefore will likely have a knock-on effect on sovereign spreads.
Measure 5: Government effectiveness
This statistic is a subset of the Worldwide Governance Indicators (WGI) developed by the World Bank. It captures perceptions of the quality of public services and civil service, and examines the degree of political pressure for the latter.
The measure also aims to capture the credibility of the government to commit to policies that have been formed. There is a direct feed-through to a government’s willingness to pay its debtors.
Some investors were surprised that the model gives a smaller weight to environmental issues than to social and governance factors. However, the fact that its output is powerful perhaps means that, currently, social and governance factors are more important than environmental factors to a sovereign’s credit strength (alternatively, it may be that environmental damage risks are only fully considered in the CDS markets after there has been environmental damage).
Conclusions
In summary, we were able to produce a simple yet powerful sovereign ESG model, that we applied to 77 sovereigns. The model shows a strong correlation between the sovereigns’ ESG scores and the sovereigns’ 5 year CDS. Moreover, the model appears to have predictive powers: those sovereigns whose CDS appeared cheap in 2010 appeared to outperform those that appears rich in 2010, in the period 2010 to 2018.
Only users who have a paid subscription or are part of a corporate subscription are able to print or copy content.
To access these options, along with all other subscription benefits, please contact info@centralbanking.com or view our subscription options here: http://subscriptions.centralbanking.com/subscribe
You are currently unable to print this content. Please contact info@centralbanking.com to find out more.
You are currently unable to copy this content. Please contact info@centralbanking.com to find out more.
Copyright Infopro Digital Limited. All rights reserved.
As outlined in our terms and conditions, https://www.infopro-digital.com/terms-and-conditions/subscriptions/ (point 2.4), printing is limited to a single copy.
If you would like to purchase additional rights please email info@centralbanking.com
Copyright Infopro Digital Limited. All rights reserved.
You may share this content using our article tools. As outlined in our terms and conditions, https://www.infopro-digital.com/terms-and-conditions/subscriptions/ (clause 2.4), an Authorised User may only make one copy of the materials for their own personal use. You must also comply with the restrictions in clause 2.5.
If you would like to purchase additional rights please email info@centralbanking.com

